Jul
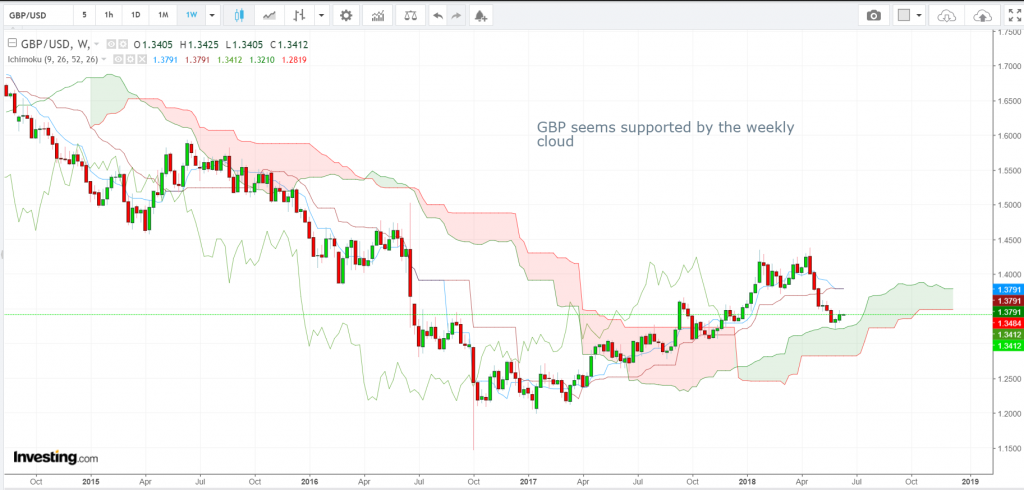
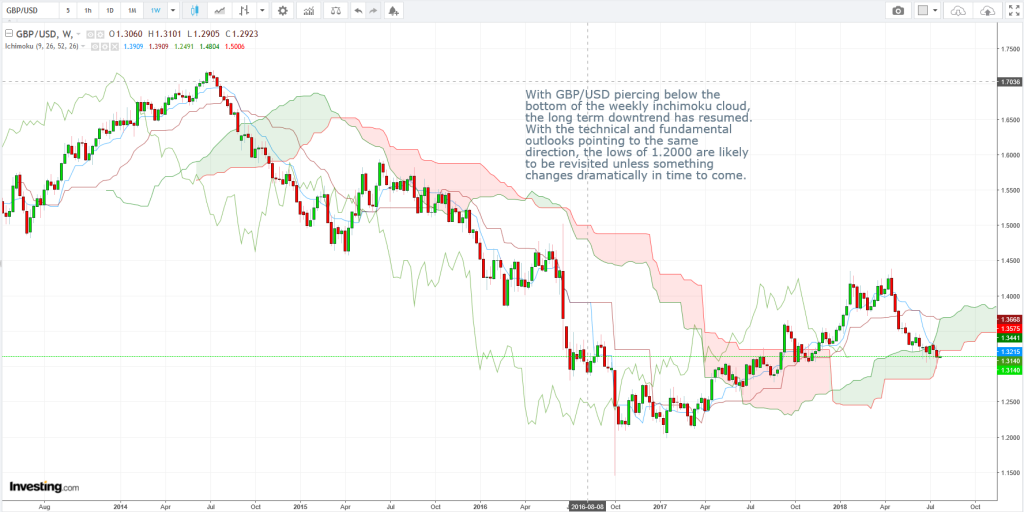
GBP/USD Weekly Candlesticks & Ichimoku Chart
With GBP/USD piercing below the bottom of the weekly Ichimoku cloud, the long term downtrend has resumed. With the technical and fundamental outlook both pointing in the same direction, the lows of 1.2000 are likely to be revisited unless something changes dramatically in time to come.
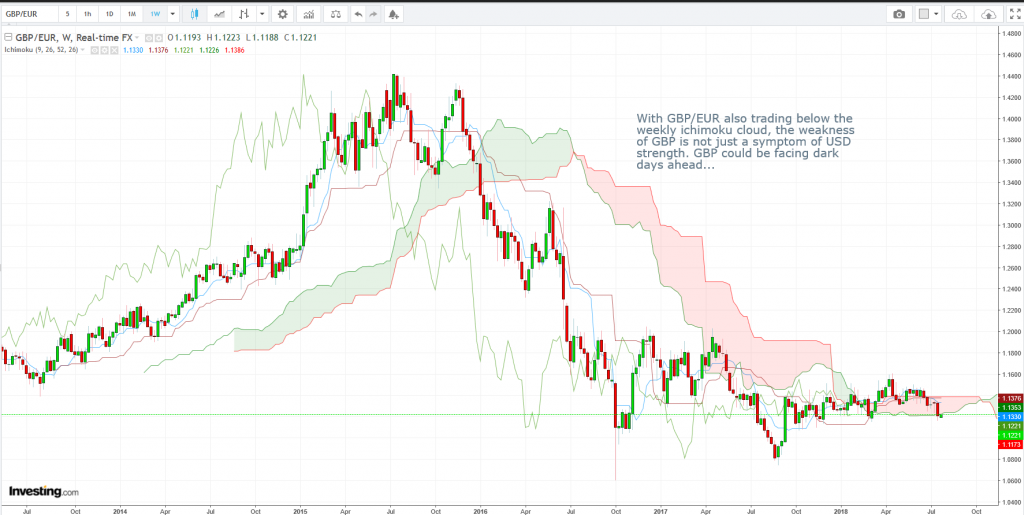
GBP/EUR Weekly Candlesticks & Ichimoku Chart
With GBP/EUR also trading below the weekly Ichimoku cloud, the weakness of GBP is not just a symptom of USD strength. GBP could be facing dark days ahead…
Vee, our Founder/CIO highlights patterns/formations on selected chart(s) every week which may have the potential to turn into trading opportunities. These charts are extracts of our weekly subscription product – “CIO’s Week Ahead Update” which provides analysis for the week ahead, first sent out on Monday of the week.
Receive first hand information on these charts and learn how to leverage on possible trading opportunities >>> Click here!
Disclaimer: The views and opinions expressed in this material do not constitute a recommendation by TrackRecord Pte. Ltd. that any particular investment, security, transaction or investment strategy is suitable for any specific person. No part of this material may be reproduced or transmitted in any form or by any means, electronic, mechanical, photocopying, recording, or otherwise, without prior written permission of TrackRecord Pte. Ltd.
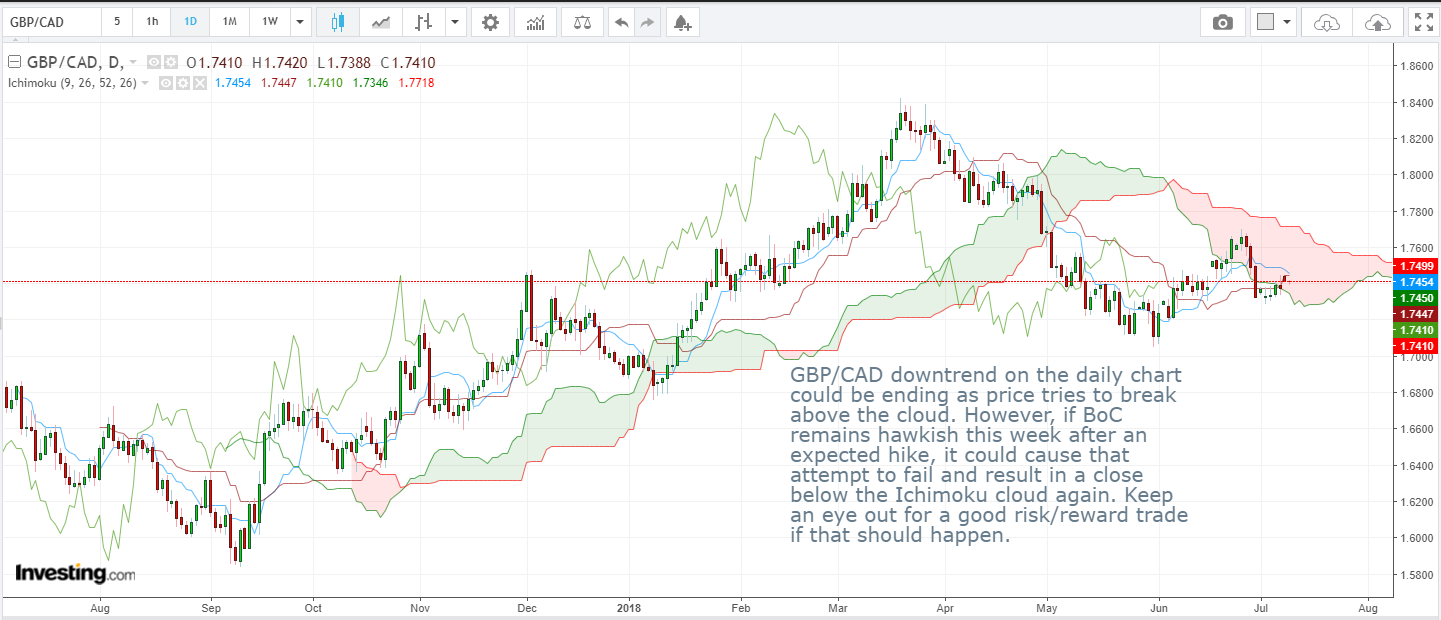 GBP/CAD Daily Candlesticks & Ichimoku Chart
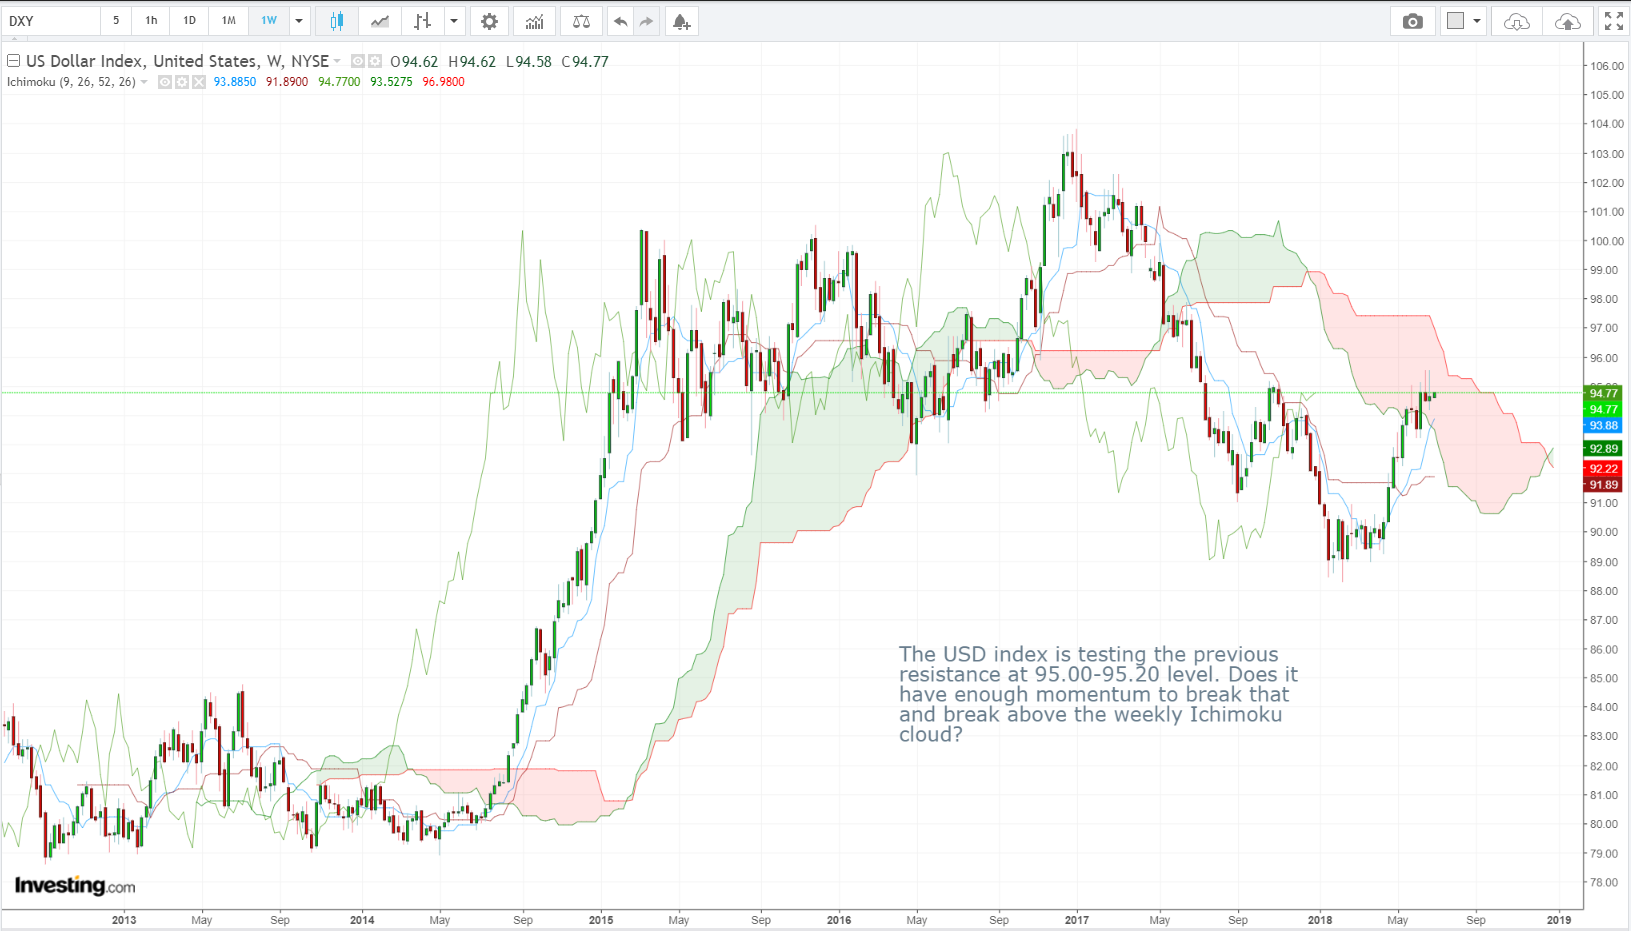 Dollar Index (DXY) Weekly Candlesticks & Ichimoku Chart
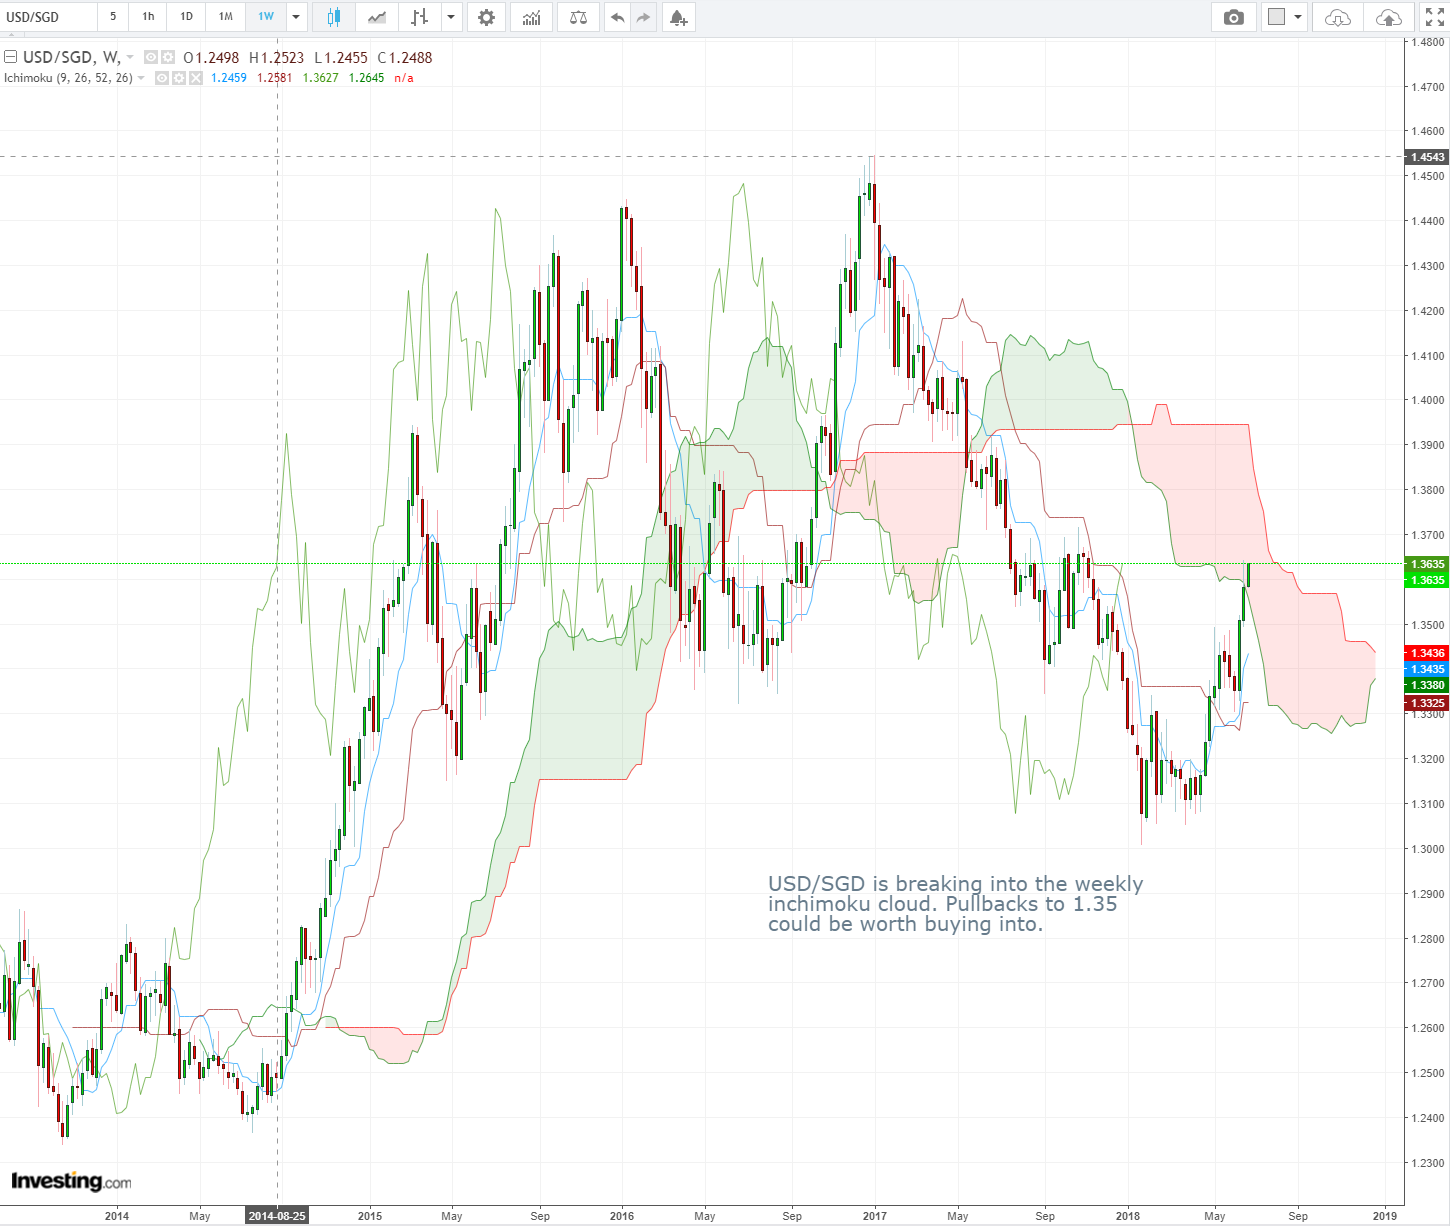 USD/SGD Weekly Candlesticks & Ichimoku Chart
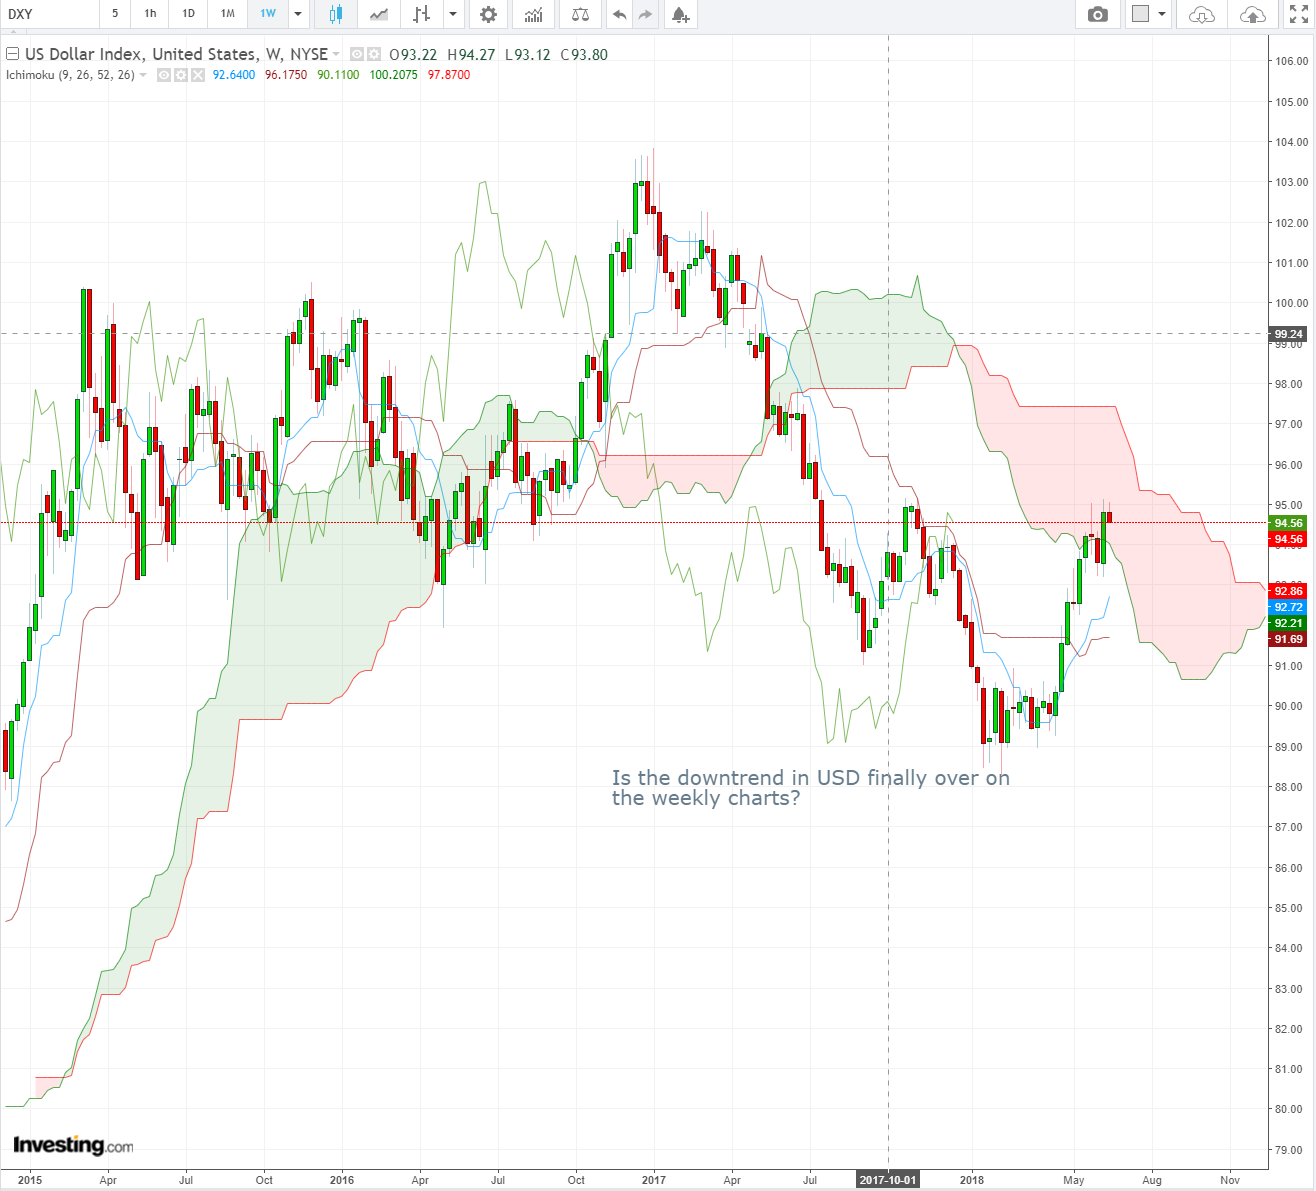 DXY (USD Index) Weekly Candlesticks & Ichimoku Chart