
EUR/USD Daily Candlesticks & Ichimoku Chart
Shorting EUR/USD against the bottom of the ichimoku cloud does seem like a good risk/reward trade based on the charts
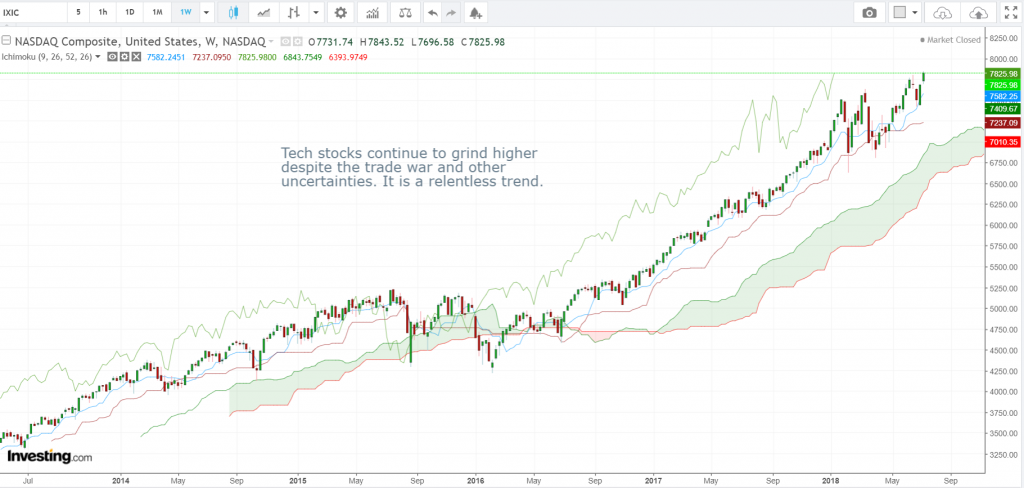
Nasdaq (IXIC) Weekly Candlesticks & Ichimoku Chart
Tech stocks continue to grind higher despite the trade war and other uncertainties. It is a relentless trend.
Vee, our Founder/CIO highlights patterns/formations on selected chart(s) every week which may have the potential to turn into trading opportunities. These charts are extracts of our weekly subscription product – “CIO’s Week Ahead Update” which provides analysis for the week ahead, first sent out on Monday of the week.
Receive first hand information on these charts and learn how to leverage on possible trading opportunities >>> Click here!
Disclaimer: The views and opinions expressed in this material do not constitute a recommendation by TrackRecord Pte. Ltd. that any particular investment, security, transaction or investment strategy is suitable for any specific person. No part of this material may be reproduced or transmitted in any form or by any means, electronic, mechanical, photocopying, recording, or otherwise, without prior written permission of TrackRecord Pte. Ltd.