
NASDAQ Weekly Candlesticks & Ichimoku Chart
At the halfway mark of 2018, Nasdaq still looks to be in a long term uptrend despite higher volatility and a more uncertain macro environment. Is Trump’s trade war enough to stop this trend?
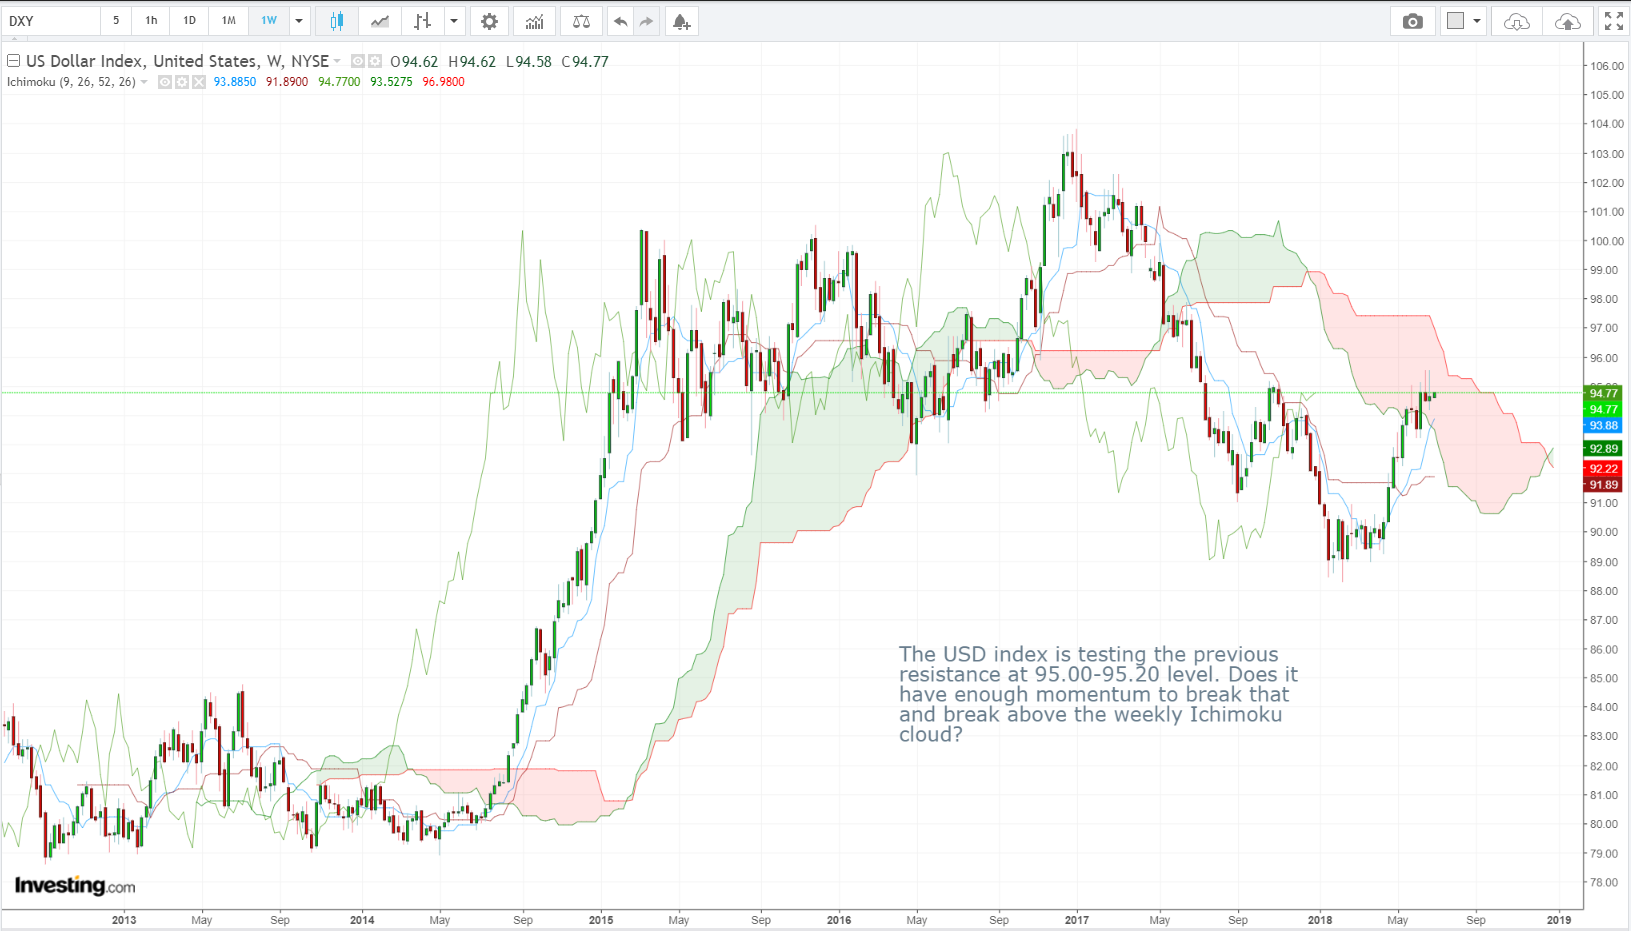 Dollar Index (DXY) Weekly Candlesticks & Ichimoku Chart
The USD index is testing the previous resistance at 95.00 – 95.20 level. Does it have enough momentum to break that and break above the weekly Ichimoku cloud?
Vee, our Founder/CIO highlights patterns/formations on selected chart(s) every week which may have the potential to turn into trading opportunities. These charts are extracts of our weekly subscription product – “CIO’s Week Ahead Update” which provides analysis for the week ahead, first sent out on Monday of the week.
Receive first hand information on these charts and learn how to leverage on possible trading opportunities >>> Click here!