Trade Opportunity: AUDUSD

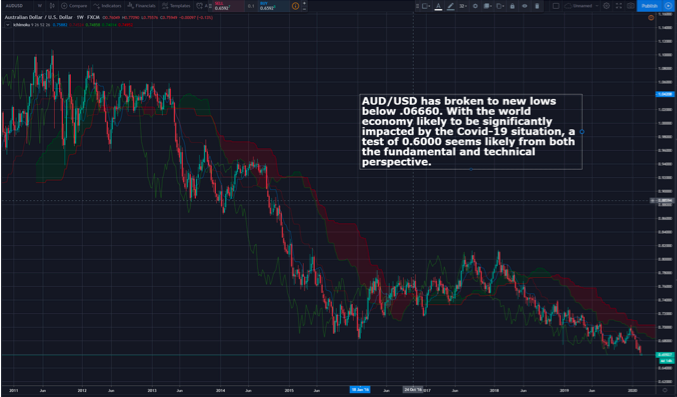
AUD/USD Weekly Candlesticks & Ichimoku Chart –   SHORT  

AUD/USD has broken to new lows below 0.6660. With the world economy likely to be significantly impacted by the Covid-19 situation, a test of 0.6000 seems likely from both the fundamental and technical perspective.


Vee, our Founder/CIO highlights patterns/formations on selected chart(s) every week which may have the potential to turn into trading opportunities. These charts are first sent out on Monday of the week to the TRACKRECORD COMMUNITY which helps them to filter out the noise and condense only what’s important in the markets for the week ahead.

Disclaimer: The views and opinions expressed in this material do not constitute a recommendation by TrackRecord Pte. Ltd. that any particular investment, security, transaction or investment strategy is suitable for any specific person. No part of this material may be reproduced or transmitted in any form or by any means, electronic, mechanical, photocopying, recording, or otherwise, without prior written permission of TrackRecord Pte. Ltd

Trade Opportunity: EURUSD

EUR/USD Monthly Candlesticks & Ichimoku Chart  SHORT
On the longer term monthly chart, EUR/USD seems poised for a fall to 1.05. Given our bearish take on the Eurozone, shorting EUR vs USD, CAD and other currencies will become the focus going into 2019. Obviously this is a long term view and levels will need to be selected more tactically on the charts of shorter time frames going forward.


Vee, our Founder/CIO highlights patterns/formations on selected chart(s) every week which may have the potential to turn into trading opportunities. These charts are first sent out on Monday of the week to members of our weekly subscription product – “CIO’s Week Ahead Update”, which helps to filter out the noise and condense only what’s important in the markets for the week ahead.

Disclaimer: The views and opinions expressed in this material do not constitute a recommendation by TrackRecord Pte. Ltd. that any particular investment, security, transaction or investment strategy is suitable for any specific person. No part of this material may be reproduced or transmitted in any form or by any means, electronic, mechanical, photocopying, recording, or otherwise, without prior written permission of TrackRecord Pte. Ltd

Trade Opportunities: Hang Seng Stock Index, AUDUSD

Hang Seng Index (HSI) Daily Candlesticks & Ichimoku Chart
The Hang Seng Stock Index (Hong Kong) is trading better recently. It is currently testing the daily ichimoku cloud, and will be a strong positive sign should it manage a close above the cloud. Is this just shortcovering ahead of the meeting between Trump and Xi at the G20 Summit or is it something more?

AUD/USD Daily Candlesticks & Ichimoku Chart
AUD/USD attempting to establish itself above the daily Ichimoku cloud again. Will it succeed this time?

Vee, our Founder/CIO highlights patterns/formations on selected chart(s) every week which may have the potential to turn into trading opportunities. These charts are first sent out on Monday of the week to members of our weekly subscription product – “CIO’s Week Ahead Update”, which helps to filter out the noise and condense only what’s important in the markets for the week ahead.

Disclaimer: The views and opinions expressed in this material do not constitute a recommendation by TrackRecord Pte. Ltd. that any particular investment, security, transaction or investment strategy is suitable for any specific person. No part of this material may be reproduced or transmitted in any form or by any means, electronic, mechanical, photocopying, recording, or otherwise, without prior written permission of TrackRecord Pte. Ltd

Trade Opportunities: USDJPY, NASDAQ

USD/JPY Daily Candlesticks & Ichimoku Chart   SHORT 
USD/JPY has broken into the daily Ichimoku cloud. Looking to sell rallies if opportunities should arise.


NASDAQ Composite Index (IXIC) Weekly Candlesticks & Ichimoku Chart
The NASDAQ Composite Index has started the week badly, with the selloff sending it into the weekly Ichimoku cloud. The cloud has been breached several times intra-week recently but somehow, the price has always managed to recover above the clouds.


Vee, our Founder/CIO highlights patterns/formations on selected chart(s) every week which may have the potential to turn into trading opportunities. These charts are first sent out on Monday of the week to members of our weekly subscription product – “CIO’s Week Ahead Update”, which helps to filter out the noise and condense only what’s important in the markets for the week ahead.

Let us know what you think in the comments below!

Disclaimer: The views and opinions expressed in this material do not constitute a recommendation by TrackRecord Pte. Ltd. that any particular investment, security, transaction or investment strategy is suitable for any specific person. No part of this material may be reproduced or transmitted in any form or by any means, electronic, mechanical, photocopying, recording, or otherwise, without prior written permission of TrackRecord Pte. Ltd

Trade Opportunities: AUDJPY, EURCAD

AUD/JPY Daily Candlesticks & Ichimoku Chart   SHORT 
With the bearish close on Fri, shorting AUD/JPY with a stop above the recent highs gives us a good risk vs reward short based on the daily chart.


EUR/CAD Daily Candlesticks & Ichimoku Chart   SHORT 
Last week, EUR/CAD tried to test the bottom of the daily Ichimoku clouds and failed. The close also resulted in a bearish candle. The recent two previous occasions when this occurred resulted in sell-offs in the days after. There’s a good chance that EUR/CAD will test new lows soon. (Note: EUR/CAD has reached our short term target yesterday and profits taken – after this chart was sent to our subscribers. Will look to sell again on rallies as we foresee EUR/CAD to continue moving lower)


Vee, our Founder/CIO highlights patterns/formations on selected chart(s) every week which may have the potential to turn into trading opportunities. These charts are extracts of our weekly subscription product – “CIO’s Week Ahead Update” which provides analysis for the week ahead, first sent out on Monday of the week.

Let us know what you think in the comments below!

Disclaimer: The views and opinions expressed in this material do not constitute a recommendation by TrackRecord Pte. Ltd. that any particular investment, security, transaction or investment strategy is suitable for any specific person. No part of this material may be reproduced or transmitted in any form or by any means, electronic, mechanical, photocopying, recording, or otherwise, without prior written permission of TrackRecord Pte. Ltd

Trade Opportunities: EUR/JPY, NASDAQ

EUR/JPY Weekly Candlesticks & Ichimoku Chart SHORT
EUR/JPY closed last week below the weekly Ichimoku cloud. Until it recovers to close above the cloud, sell on rallies is the way to go.


NASDAQ Composite Index Weekly Candlesticks & Ichimoku Chart
The NASDAQ Composite Index has not traded below the weekly Ichimoku cloud since mid 2016. It is now trading near critical support levels. A close below the cloud will be quite damaging to the longer term technical picture.


Vee, our Founder/CIO highlights patterns/formations on selected chart(s) every week which may have the potential to turn into trading opportunities. These charts are extracts of our weekly subscription product – “CIO’s Week Ahead Update” which provides analysis for the week ahead, first sent out on Monday of the week.

Let us know what you think in the comments below!

Disclaimer: The views and opinions expressed in this material do not constitute a recommendation by TrackRecord Pte. Ltd. that any particular investment, security, transaction or investment strategy is suitable for any specific person. No part of this material may be reproduced or transmitted in any form or by any means, electronic, mechanical, photocopying, recording, or otherwise, without prior written permission of TrackRecord Pte. Ltd

Trade Opportunities: EUR/CAD, NZD/USD

EUR/CAD Weekly Candlesticks & Ichimoku Chart – SHORT
As the economies of Canada and the Eurozone continue to diverge, EUR/CAD is likely to test much lower levels. The recent rally presents us with a good opportunity to get involved.


NZD/USD Daily Candlesticks & Ichimoku Chart – SHORT
NZD/USD seems to be having trouble breaking above 0.6600-10 area which is close to the bottom of the daily ichimoku cloud. This makes for a good risk/reward opportunity to add to shorts.


Vee, our Founder/CIO highlights patterns/formations on selected chart(s) every week which may have the potential to turn into trading opportunities. These charts are extracts of our weekly subscription product – “CIO’s Week Ahead Update” which provides analysis for the week ahead, first sent out on Monday of the week.

Let us know what you think in the comments below!

Disclaimer: The views and opinions expressed in this material do not constitute a recommendation by TrackRecord Pte. Ltd. that any particular investment, security, transaction or investment strategy is suitable for any specific person. No part of this material may be reproduced or transmitted in any form or by any means, electronic, mechanical, photocopying, recording, or otherwise, without prior written permission of TrackRecord Pte. Ltd

Trade Opportunities: NASDAQ, Bitcoin

Bitcoin (BTC) Daily Candlesticks & Ichimoku Chart  – LONG
Bitcoin (BTC) jumped to hit highs of 7700-7800 within minutes yesterday before falling back to below 7000. A decisive close above the cloud could get very interesting.


NASDAQ Index Weekly Candlesticks & Ichimoku Chart
As cautioned in last week’s report, a correction on NASDAQ is on the cards. The support on the weekly chart is at 7100 level.


Vee, our Founder/CIO highlights patterns/formations on selected chart(s) every week which may have the potential to turn into trading opportunities. These charts are extracts of our weekly subscription product – “CIO’s Week Ahead Update” which provides analysis for the week ahead, first sent out on Monday of the week.

Let us know what you think in the comments below!

Disclaimer: The views and opinions expressed in this material do not constitute a recommendation by TrackRecord Pte. Ltd. that any particular investment, security, transaction or investment strategy is suitable for any specific person. No part of this material may be reproduced or transmitted in any form or by any means, electronic, mechanical, photocopying, recording, or otherwise, without prior written permission of TrackRecord Pte. Ltd


Trade Opportunities: NZD/USD, NASDAQ (8 Oct 2018)

NZD/USD Monthly Candlesticks & Ichimoku Chart
NZD/USD looks set to test 2015’s lows of 0.6230-50. If that should break, it could be targeting 0.5000 and below.


NASDAQ Index Daily Candlesticks & Ichimoku Chart
It’s been a while since NASDAQ tested the daily Ichimoku clouds. Caution is warranted if this should turn out to be a deeper retracement.


Vee, our Founder/CIO highlights patterns/formations on selected chart(s) every week which may have the potential to turn into trading opportunities. These charts are extracts of our weekly subscription product – “CIO’s Week Ahead Update” which provides analysis for the week ahead, first sent out on Monday of the week.

Let us know what you think in the comments below!

Disclaimer: The views and opinions expressed in this material do not constitute a recommendation by TrackRecord Pte. Ltd. that any particular investment, security, transaction or investment strategy is suitable for any specific person. No part of this material may be reproduced or transmitted in any form or by any means, electronic, mechanical, photocopying, recording, or otherwise, without prior written permission of TrackRecord Pte. Ltd