Trade Opportunities: USDCAD, DXY

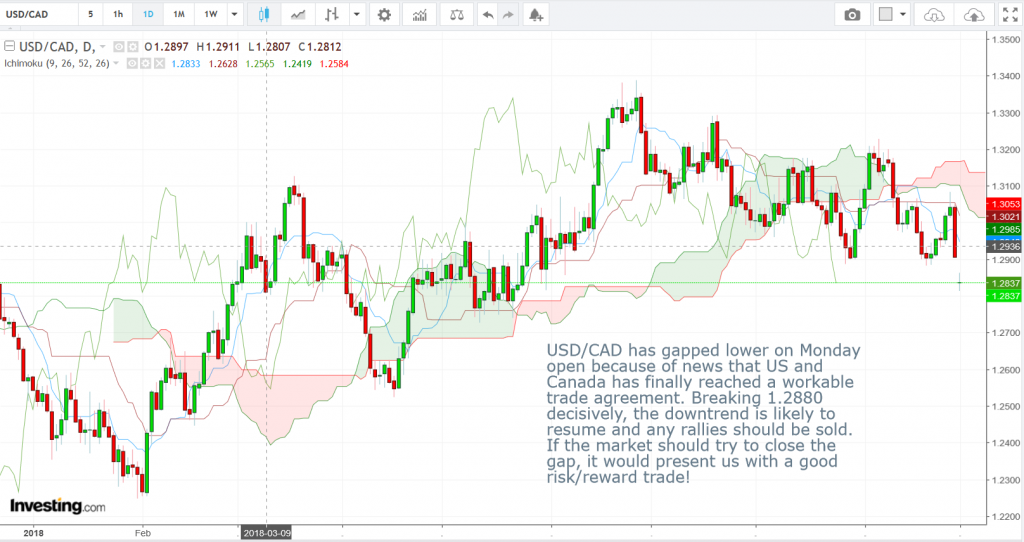
USD/CAD Daily Candlesticks & Ichimoku Chart
USD/CAD has gapped lower on Monday open because of news that US and Canada has finally reached a workable trade agreement. Breaking 1.2880 decisively, the downward trend is likely to resume and any rallies should be sold. If the market should try to close the gap, it would present us with a good risk/reward trade!


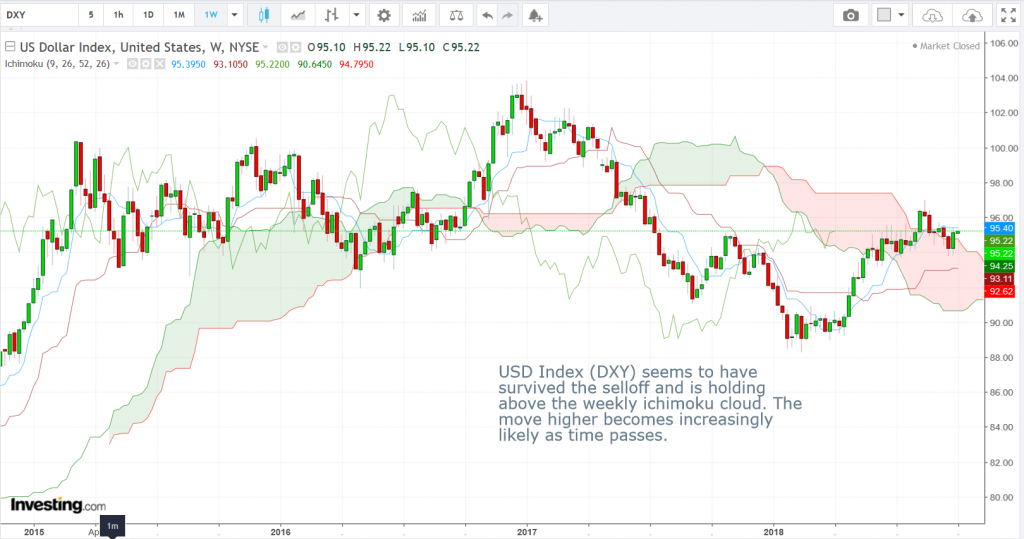
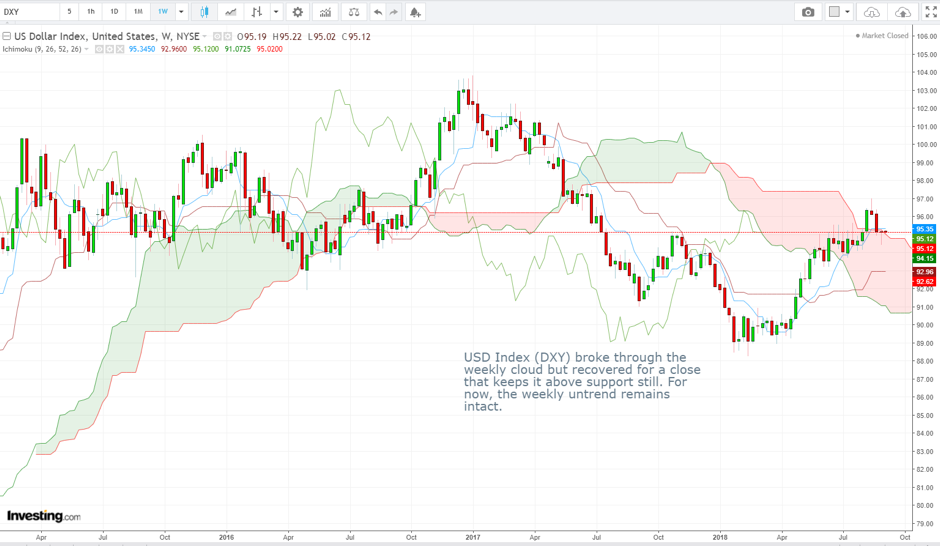
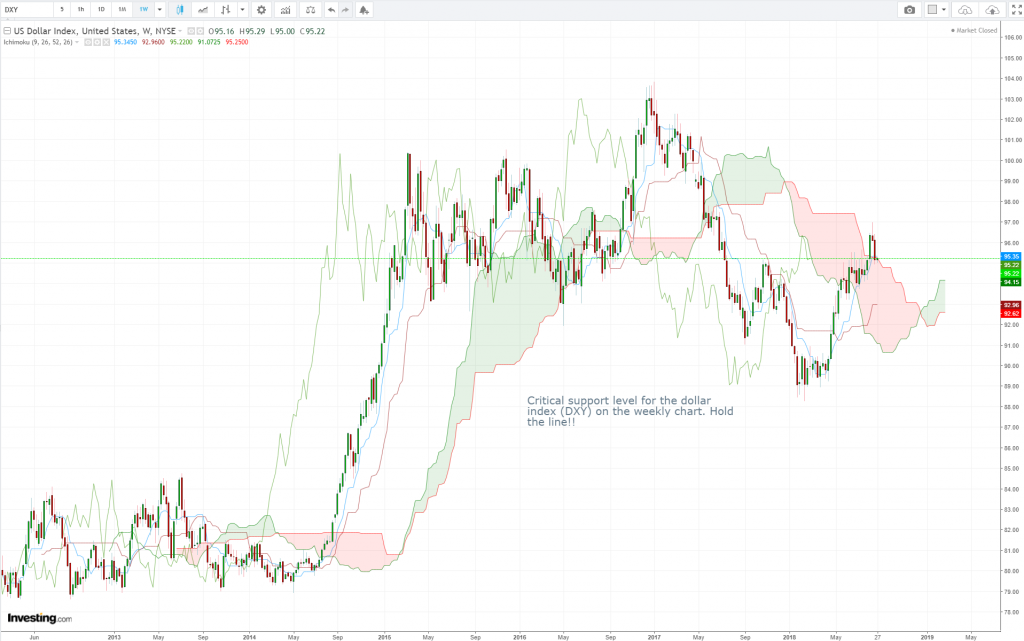
USD Index (DXY) Weekly Candlesticks & Ichimoku Chart
USD Index (DXY) seems to have survived the selloff and is holding above the weekly ichimoku cloud. The move higher becomes increasingly likely as time passes.


Vee, our Founder/CIO highlights patterns/formations on selected chart(s) every week which may have the potential to turn into trading opportunities. These charts are extracts of our weekly subscription product – “CIO’s Week Ahead Update” which provides analysis for the week ahead, first sent out on Monday of the week.

Let us know what you think in the comments below!

Disclaimer: The views and opinions expressed in this material do not constitute a recommendation by TrackRecord Pte. Ltd. that any particular investment, security, transaction or investment strategy is suitable for any specific person. No part of this material may be reproduced or transmitted in any form or by any means, electronic, mechanical, photocopying, recording, or otherwise, without prior written permission of TrackRecord Pte. Ltd

Charts of the Week (24 Sept 2018)

Chart of Spread between 10-yr and 3-month Treasury Yields vs S&P 500 Total Return Index
Note: Periods of curve inversion (i.e. when the 3-month Treasury yield is higher than that of the 10-year yield) led to periods of correction in the S&P500 Index. Currently the spread is still far from inversion territory despite all the attention on the flat 2-yr vs 10-yr Treasury spread.


US 10-year Bond Yield Weekly Candlesticks & Ichimoku Chart
US 10yr Bond Yields are attempting to take on new highs. Watch out for more pressure on Emerging Markets if the move should extend.


Vee, our Founder/CIO highlights patterns/formations on selected chart(s) every week which may have the potential to turn into trading opportunities. These charts are extracts of our weekly subscription product – “CIO’s Week Ahead Update” which provides analysis for the week ahead, first sent out on Monday of the week.

Let us know what you think in the comments below!

Disclaimer: The views and opinions expressed in this material do not constitute a recommendation by TrackRecord Pte. Ltd. that any particular investment, security, transaction or investment strategy is suitable for any specific person. No part of this material may be reproduced or transmitted in any form or by any means, electronic, mechanical, photocopying, recording, or otherwise, without prior written permission of TrackRecord Pte. Ltd.

Charts of the Week (17 Sept 2018)

NVIDIA Weekly Candlesticks & Ichimoku Chart
NVIDIA produces chips that are used for gaming, AI and cryptocurrency mining. Knowing that, and seeing a chart like this, is there any reason not to get involved?


EUR/JPY Daily Candlesticks & Ichimoku Chart
EURJPY has failed to convincingly sustain above 131.00 for months. Will the latest attempt fail again?


Vee, our Founder/CIO highlights patterns/formations on selected chart(s) every week which may have the potential to turn into trading opportunities. These charts are extracts of our weekly subscription product – “CIO’s Week Ahead Update” which provides analysis for the week ahead, first sent out on Monday of the week.

Let us know what you think in the comments below!

Disclaimer: The views and opinions expressed in this material do not constitute a recommendation by TrackRecord Pte. Ltd. that any particular investment, security, transaction or investment strategy is suitable for any specific person. No part of this material may be reproduced or transmitted in any form or by any means, electronic, mechanical, photocopying, recording, or otherwise, without prior written permission of TrackRecord Pte. Ltd.

Charts of the Week (10 Sept 2018)

Hang Seng Index Weekly Candlesticks & Ichimoku Chart
Hang Seng Stock Index looks extremely bearish on the weekly chart. It could trade to the low 20,000s in the months ahead. Look out below!


NZD/USD Daily Candlesticks & Ichimoku Chart
The downtrend continues. With no end in sight both on the fundamental and technical fronts, all rallies are meant to be sold.


Vee, our Founder/CIO highlights patterns/formations on selected chart(s) every week which may have the potential to turn into trading opportunities. These charts are extracts of our weekly subscription product – “CIO’s Week Ahead Update” which provides analysis for the week ahead, first sent out on Monday of the week.

Let us know what you think in the comments below!

Disclaimer: The views and opinions expressed in this material do not constitute a recommendation by TrackRecord Pte. Ltd. that any particular investment, security, transaction or investment strategy is suitable for any specific person. No part of this material may be reproduced or transmitted in any form or by any means, electronic, mechanical, photocopying, recording, or otherwise, without prior written permission of TrackRecord Pte. Ltd.

Charts of the Week (3 Sep 2018)

DXY Weekly Candlesticks & Ichimoku Chart
USD Index (DXY) broke through the weekly cloud but recovered for a close that keeps it above support still. For now, the weekly uptrend remains intact.
 
 
Amazon (AMZN) Monthly Candlesticks & Ichimoku Chart
Is there any reason not to be on board this train?


Vee, our Founder/CIO highlights patterns/formations on selected chart(s) every week which may have the potential to turn into trading opportunities. These charts are extracts of our weekly subscription product – “CIO’s Week Ahead Update” which provides analysis for the week ahead, first sent out on Monday of the week.

Let us know what you think in the comments below!

Disclaimer: The views and opinions expressed in this material do not constitute a recommendation by TrackRecord Pte. Ltd. that any particular investment, security, transaction or investment strategy is suitable for any specific person. No part of this material may be reproduced or transmitted in any form or by any means, electronic, mechanical, photocopying, recording, or otherwise, without prior written permission of TrackRecord Pte. Ltd.

Charts of the Week (27 Aug 2018)

AUD/NZD Daily Candlesticks & Ichimoku Chart
The weakness of the AUD caused mainly by the political uncertainty surrounding the leadership tussle is now over. Expect AUD to regain ground vs the NZD as RBNZ remains a lot more dovish than RBA. The daily reversal candle on Friday also presents an opportunity with good risk reward.


DXY Weekly Candlesticks & Ichimoku Chart
Critical support level for the dollar index (DXY) on the weekly chart. Hold the line!


Vee, our Founder/CIO highlights patterns/formations on selected chart(s) every week which may have the potential to turn into trading opportunities. These charts are extracts of our weekly subscription product – “CIO’s Week Ahead Update” which provides analysis for the week ahead, first sent out on Monday of the week.

Let us know what you think in the comments below!

Disclaimer: The views and opinions expressed in this material do not constitute a recommendation by TrackRecord Pte. Ltd. that any particular investment, security, transaction or investment strategy is suitable for any specific person. No part of this material may be reproduced or transmitted in any form or by any means, electronic, mechanical, photocopying, recording, or otherwise, without prior written permission of TrackRecord Pte. Ltd.

Charts of the Week (20 Aug 2018)

Apple (AAPL) Stock Weekly Candlesticks & Ichimoku Chart
AAPL relentlessly marches higher. Warren Buffett continues to add to Berkshire Hathaway’s holdings. Is there any reason to think the trend will not continue?


USD/CNH Weekly Candlesticks & Ichimoku Chart
A strong reversal candle on the weekly chart. Is this the beginning of a fierce retracement?


Vee, our Founder/CIO highlights patterns/formations on selected chart(s) every week which may have the potential to turn into trading opportunities. These charts are extracts of our weekly subscription product – “CIO’s Week Ahead Update” which provides analysis for the week ahead, first sent out on Monday of the week.

Let us know what you think in the comments below!

Disclaimer: The views and opinions expressed in this material do not constitute a recommendation by TrackRecord Pte. Ltd. that any particular investment, security, transaction or investment strategy is suitable for any specific person. No part of this material may be reproduced or transmitted in any form or by any means, electronic, mechanical, photocopying, recording, or otherwise, without prior written permission of TrackRecord Pte. Ltd.

Charts of the Week (13 Aug 2018)

EUR/USD Weekly Candlesticks & Ichimoku Chart
With the close of the EURUSD below the weekly cloud, the bear market has well and truly started…


EUR/JPY Weekly Candlesticks & Ichimoku Chart
EUR/JPY is also trading below the weekly Ichimoku cloud. A close below this week would be very bearish indeed.


Vee, our Founder/CIO highlights patterns/formations on selected chart(s) every week which may have the potential to turn into trading opportunities. These charts are extracts of our weekly subscription product – “CIO’s Week Ahead Update” which provides analysis for the week ahead, first sent out on Monday of the week.

Let us know what you think in the comments below!

Disclaimer: The views and opinions expressed in this material do not constitute a recommendation by TrackRecord Pte. Ltd. that any particular investment, security, transaction or investment strategy is suitable for any specific person. No part of this material may be reproduced or transmitted in any form or by any means, electronic, mechanical, photocopying, recording, or otherwise, without prior written permission of TrackRecord Pte. Ltd.

Charts of the Week (6 Aug 2018)

CAD/JPY Daily Candlesticks & Ichimoku Chart
CAD/JPY looks poised to retrace back to 84 handle on the daily chart. With JPY trading strong given the uncertainty on the trade war front, it is a good countertrade to have in a portfolio that is risk-seeking.


CAD/JPY Weekly Candlesticks & Ichimoku Chart
On the weekly CAD/JPY chart, it looks like good risk/reward to sell against the bottom of the Ichimoku cloud. With both the daily (above) and weekly charts pointing in the same direction, it is worth a shot!


Vee, our Founder/CIO highlights patterns/formations on selected chart(s) every week which may have the potential to turn into trading opportunities. These charts are extracts of our weekly subscription product – “CIO’s Week Ahead Update” which provides analysis for the week ahead, first sent out on Monday of the week.

Let us know what you think in the comments below!

Disclaimer: The views and opinions expressed in this material do not constitute a recommendation by TrackRecord Pte. Ltd. that any particular investment, security, transaction or investment strategy is suitable for any specific person. No part of this material may be reproduced or transmitted in any form or by any means, electronic, mechanical, photocopying, recording, or otherwise, without prior written permission of TrackRecord Pte. Ltd.

Charts of the Week (30 July 2018)

SGD/JPY Weekly Candlesticks & Ichimoku Chart
Fundamentally, as trade tensions worsen, SGD should weaken in tandem with CNY while risk aversion will cause JPY to strengthen. On the charts, SGD/JPY is trying to break below the Ichimoku clouds. Keep an eye on this as it could develop into a strong bear trend on the weekly chart.


Nasdaq Composite Weekly Candlesticks & Ichimoku Chart
Although fundamentals still point to higher levels for Nasdaq and the uptrend remains intact, the close last week on the candle chart could be a sign that a retracement is due.


Vee, our Founder/CIO highlights patterns/formations on selected chart(s) every week which may have the potential to turn into trading opportunities. These charts are extracts of our weekly subscription product – “CIO’s Week Ahead Update” which provides analysis for the week ahead, first sent out on Monday of the week.

Receive first hand information on these charts and learn how to leverage on possible trading opportunities >>> Click here!


Disclaimer: The views and opinions expressed in this material do not constitute a recommendation by TrackRecord Pte. Ltd. that any particular investment, security, transaction or investment strategy is suitable for any specific person. No part of this material may be reproduced or transmitted in any form or by any means, electronic, mechanical, photocopying, recording, or otherwise, without prior written permission of TrackRecord Pte. Ltd.