
USD/MXN Weekly Candlesticks & Ichimoku Chart
USD/MXN is trying to break through the bottom of the weekly Ichimoku cloud. With the possible improvement of a working relationship between the new Mexican president and Trump, the fundamentals are also reaffirming what the technicals are indicating. A close below the cloud will be a good indicator that the weekly downtrend has begun.
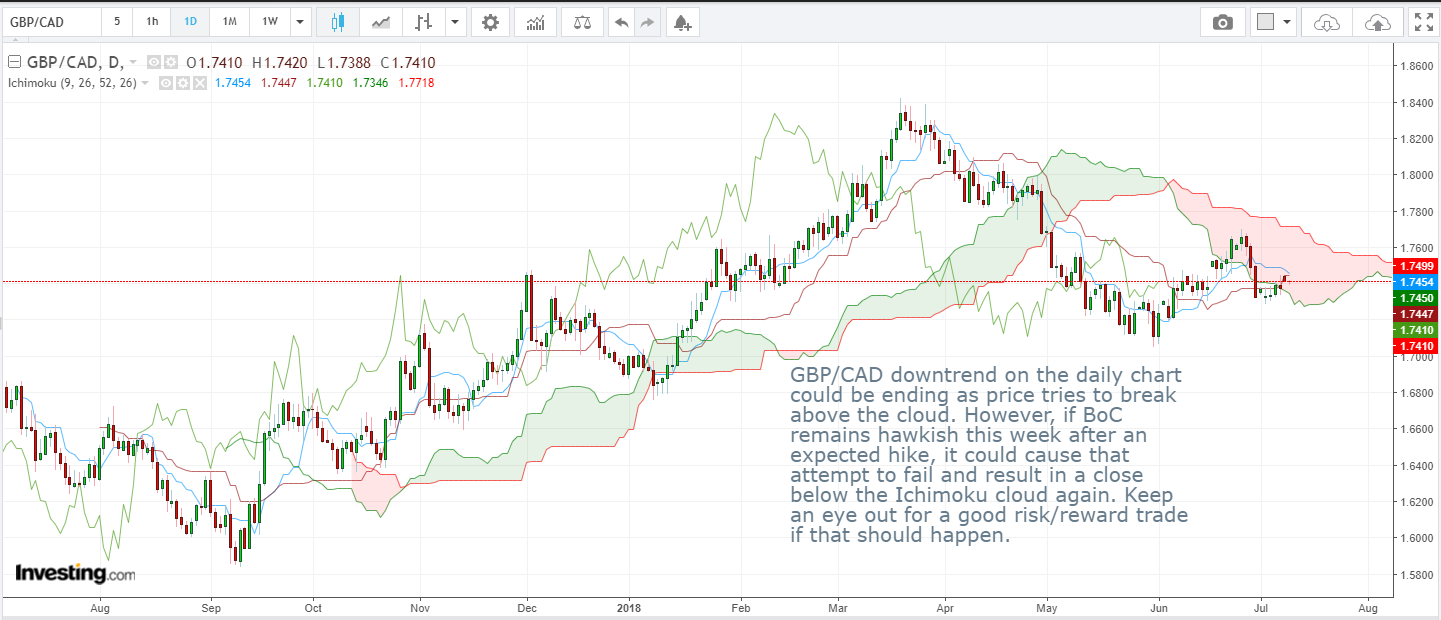 GBP/CAD Daily Candlesticks & Ichimoku Chart
GBP/CAD downtrend on the daily chart could be ending as price tries to break above the cloud. However, if BoC remains hawkish this week after an expected hike, it could cause that attempt to fail and result in a close below the Ichimoku cloud again. Keep an eye out for a good risk/reward trade if that should happen.
Vee, our Founder/CIO highlights patterns/formations on selected chart(s) every week which may have the potential to turn into trading opportunities. These charts are extracts of our weekly subscription product – “CIO’s Week Ahead Update” which provides analysis for the week ahead, first sent out on Monday of the week.
Receive first hand information on these charts and learn how to leverage on possible trading opportunities >>> Click here!
Disclaimer: The views and opinions expressed in this material do not constitute a recommendation by TrackRecord Pte. Ltd. that any particular investment, security, transaction or investment strategy is suitable for any specific person. No part of this material may be reproduced or transmitted in any form or by any means, electronic, mechanical, photocopying, recording, or otherwise, without prior written permission of TrackRecord Pte. Ltd.