
AUD/NZD Daily Candlesticks & Ichimoku Chart
AUD/NZD trading above the daily ichimoku clouds for the first time since Dec 2017. The downtrend seems to be over…
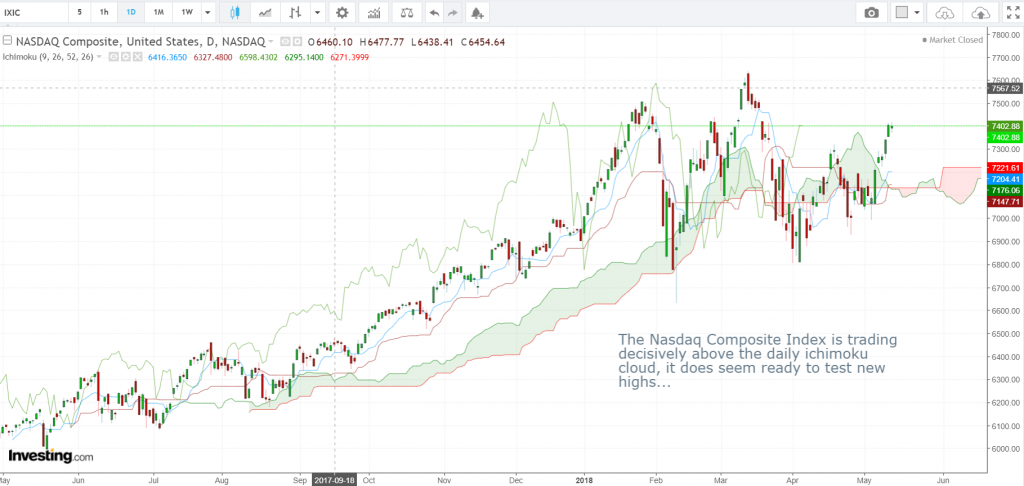
NASDAQ Composite Index Daily Candlesticks & Ichimoku Chart
The Nasdaq Composite Index is trading decisively above the daily Ichimoku cloud, it does seem ready to test new highs…
Vee, our Founder/CIO highlights patterns/formations on selected chart(s) every week which may have the potential to turn into trading opportunities.
These charts are extracts of our weekly subscription product – “CIO’s Week Ahead Update” which provides analysis for the week ahead, first sent out on Monday of the week.
Want to receive first hand information on these charts and learn how to leverage on possible trading opportunities? Click here!