
Facebook (FB) Weekly Candlesticks & Ichimoku Chart
Despite FB’s recent troubles, the stock has recovered from the lows and is making new highs. What can stop this strong uptrend?
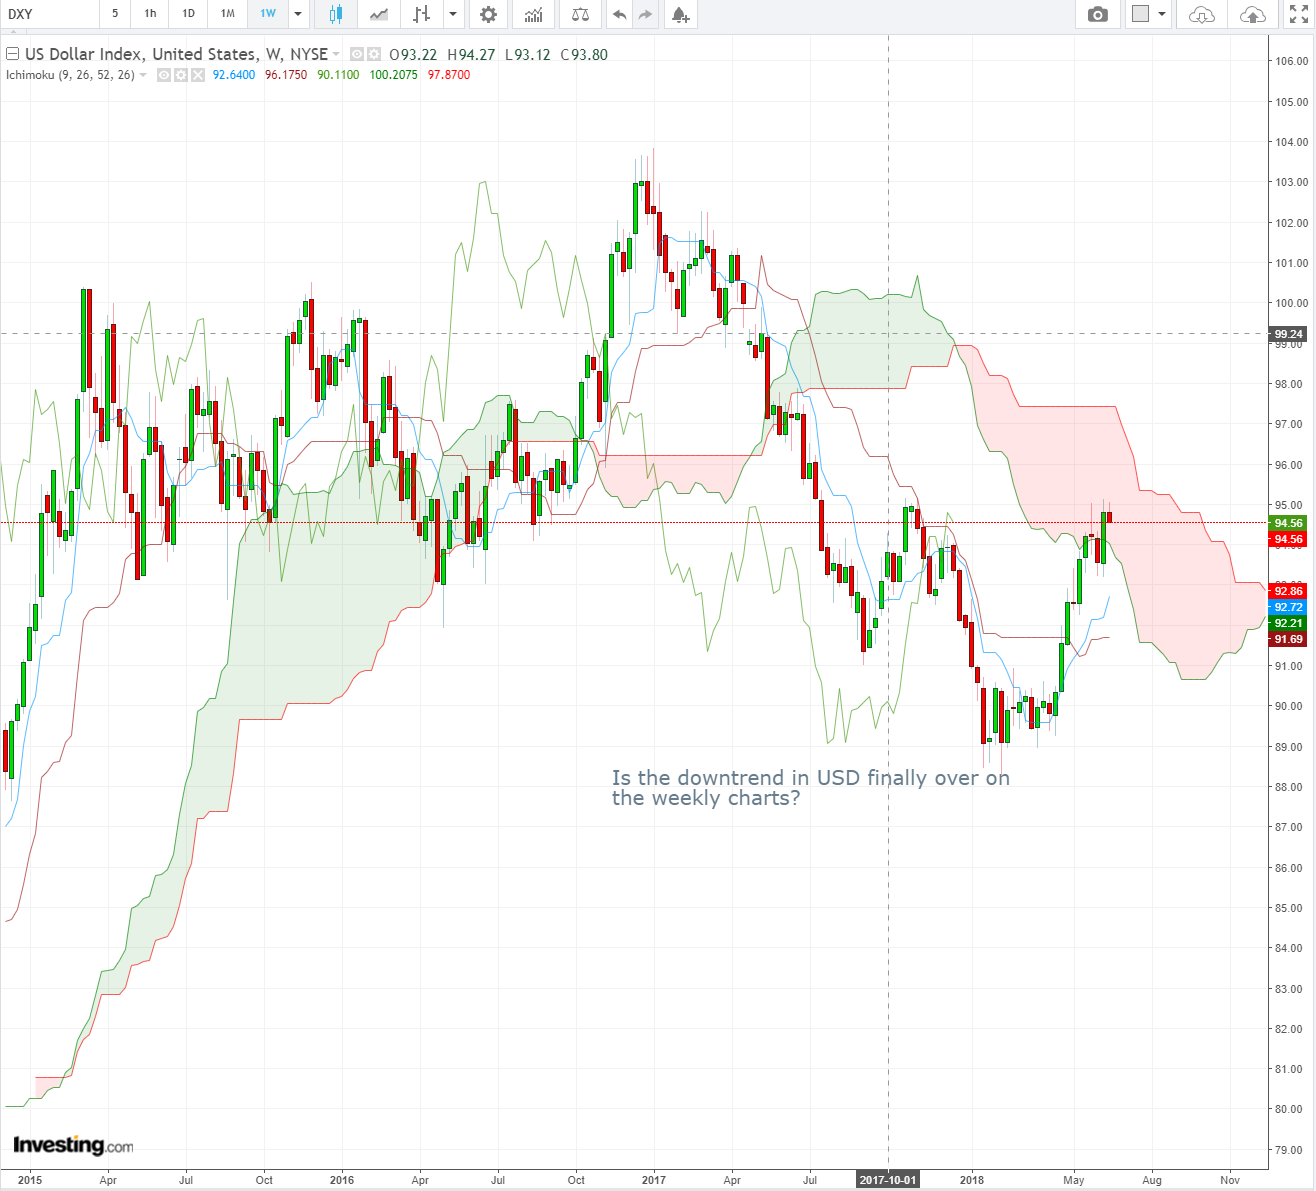 DXY (USD Index) Weekly Candlesticks & Ichimoku Chart
Is the downtrend in USD finally over on the weekly charts?
Vee, our Founder/CIO highlights patterns/formations on selected chart(s) every week which may have the potential to turn into trading opportunities.
These charts are extracts of our weekly subscription product – “CIO’s Week Ahead Update” which provides analysis for the week ahead, first sent out on Monday of the week.
Want to receive first hand information on these charts and learn how to leverage on possible trading opportunities? Click here!