
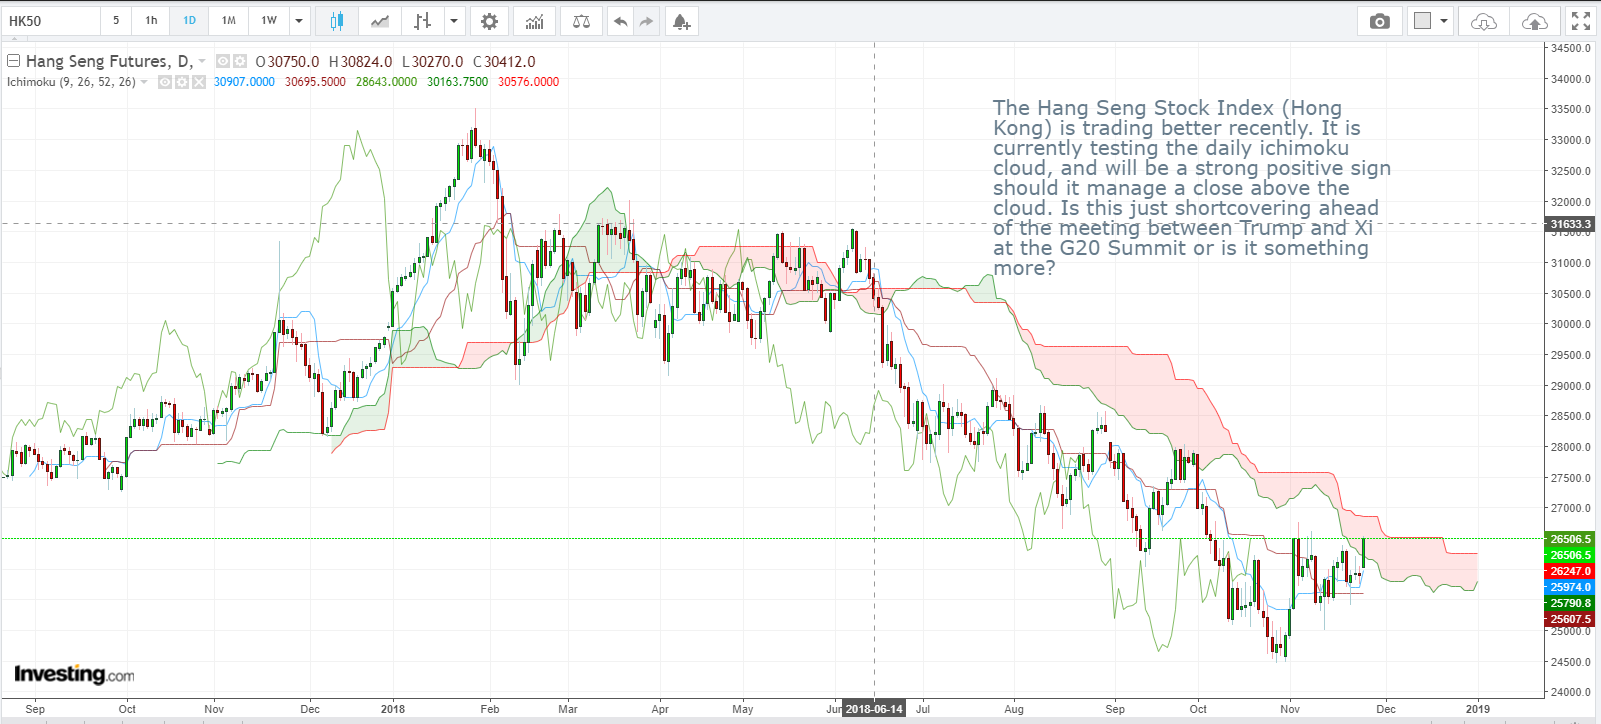
Hang Seng Index (HSI) Daily Candlesticks & Ichimoku Chart
The Hang Seng Stock Index (Hong Kong) is trading better recently. It is currently testing the daily ichimoku cloud, and will be a strong positive sign should it manage a close above the cloud. Is this just shortcovering ahead of the meeting between Trump and Xi at the G20 Summit or is it something more?
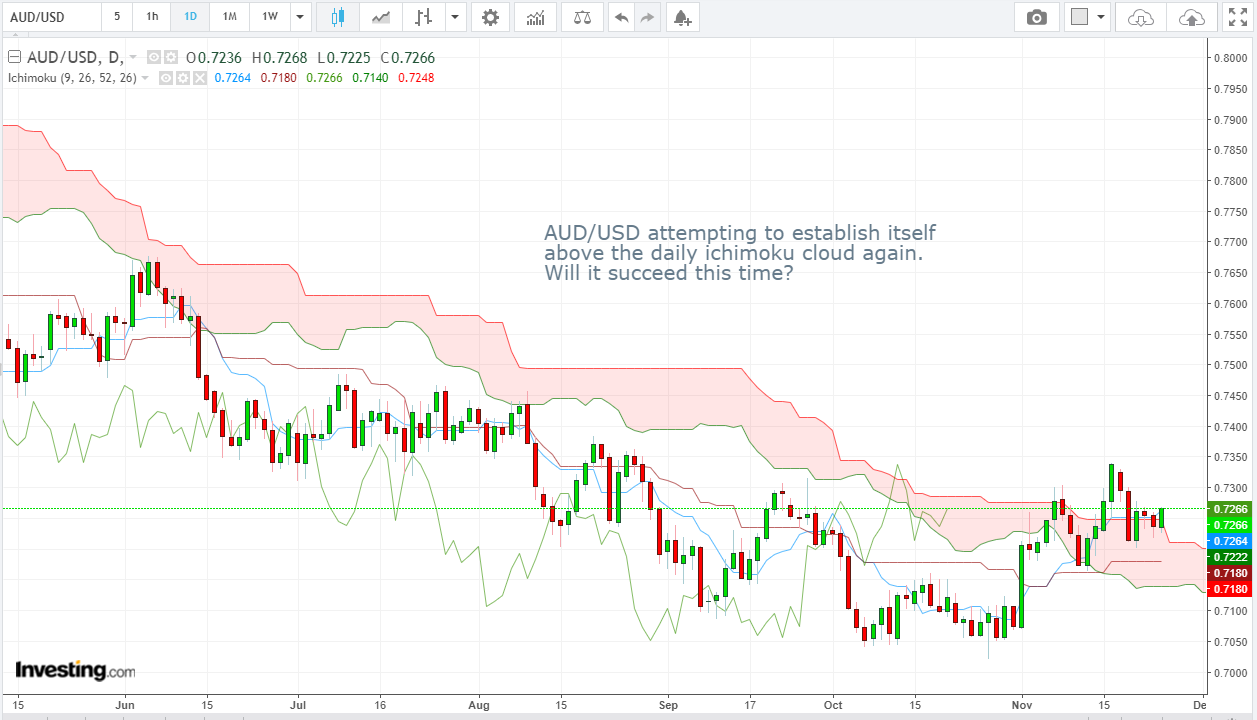
AUD/USD Daily Candlesticks & Ichimoku Chart
AUD/USD attempting to establish itself above the daily Ichimoku cloud again. Will it succeed this time?
Vee, our Founder/CIO highlights patterns/formations on selected chart(s) every week which may have the potential to turn into trading opportunities. These charts are first sent out on Monday of the week to members of our weekly subscription product – “CIO’s Week Ahead Update”, which helps to filter out the noise and condense only what’s important in the markets for the week ahead.
Disclaimer: The views and opinions expressed in this material do not constitute a recommendation by TrackRecord Pte. Ltd. that any particular investment, security, transaction or investment strategy is suitable for any specific person. No part of this material may be reproduced or transmitted in any form or by any means, electronic, mechanical, photocopying, recording, or otherwise, without prior written permission of TrackRecord Pte. Ltd