
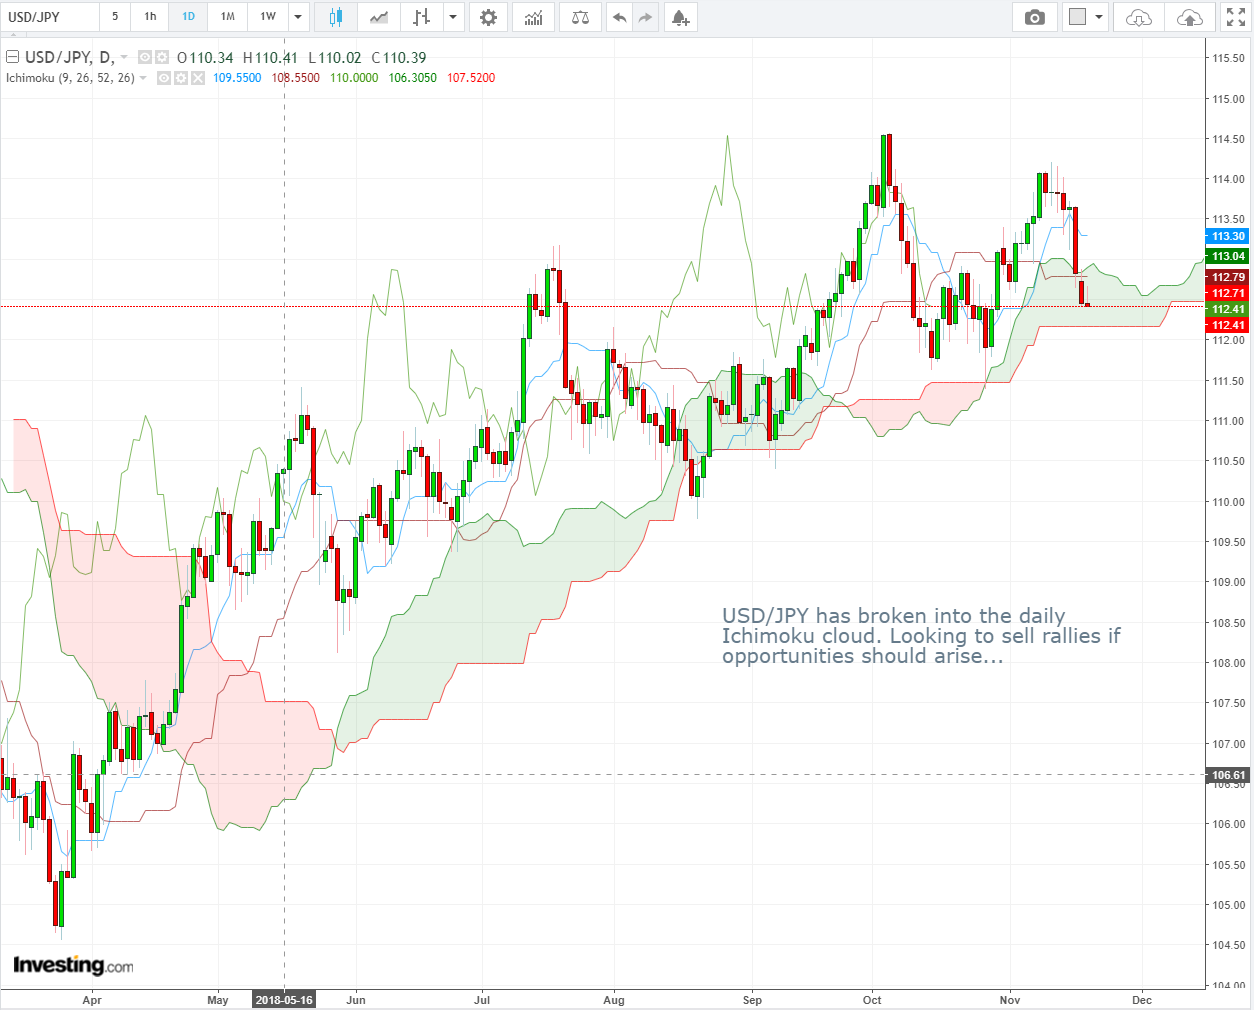
USD/JPY Daily Candlesticks & Ichimoku Chart SHORT
USD/JPY has broken into the daily Ichimoku cloud. Looking to sell rallies if opportunities should arise.
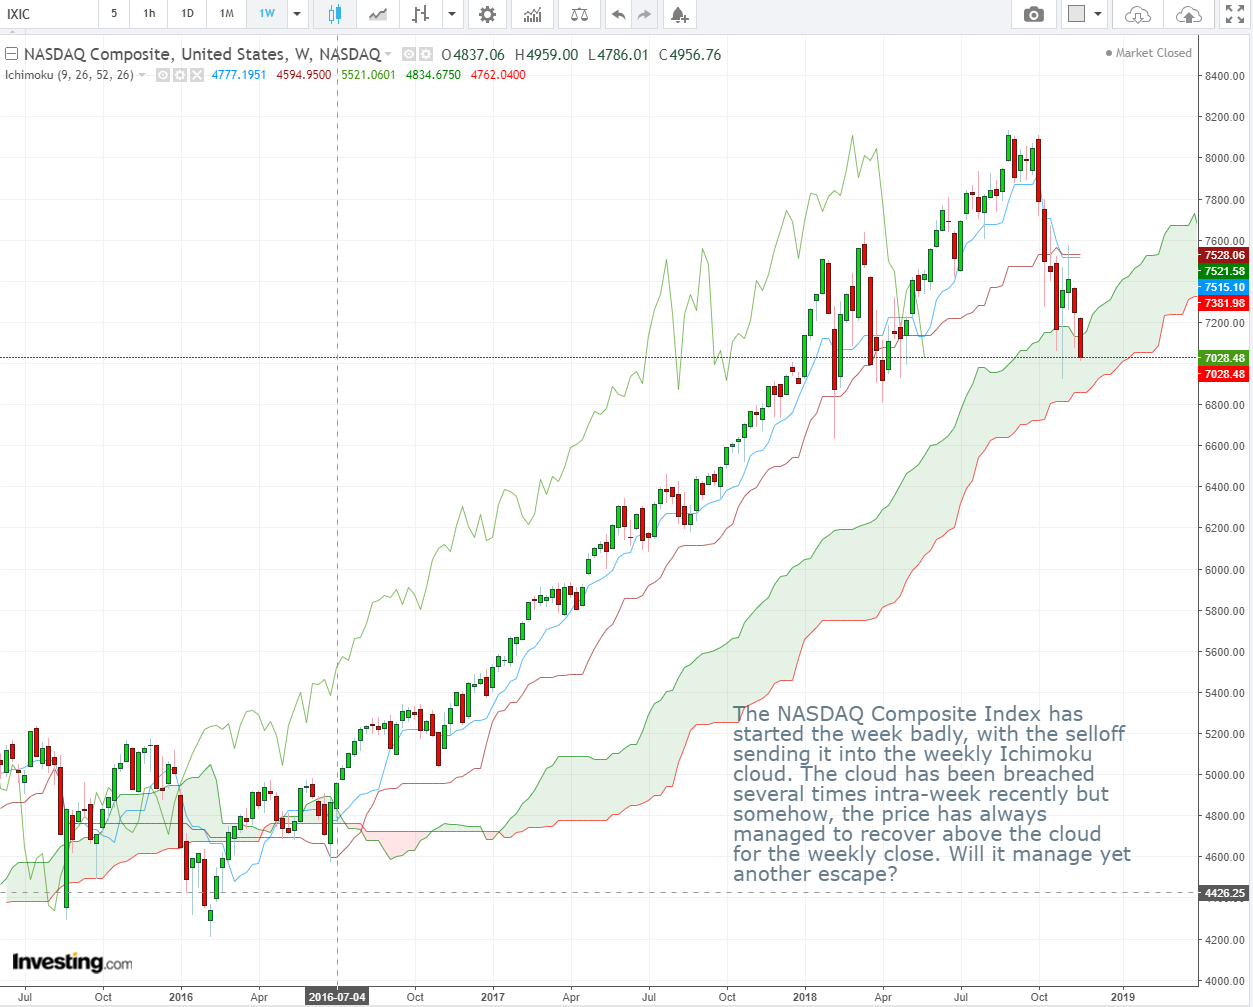
NASDAQ Composite Index (IXIC) Weekly Candlesticks & Ichimoku Chart
The NASDAQ Composite Index has started the week badly, with the selloff sending it into the weekly Ichimoku cloud. The cloud has been breached several times intra-week recently but somehow, the price has always managed to recover above the clouds.
Vee, our Founder/CIO highlights patterns/formations on selected chart(s) every week which may have the potential to turn into trading opportunities. These charts are first sent out on Monday of the week to members of our weekly subscription product – “CIO’s Week Ahead Update”, which helps to filter out the noise and condense only what’s important in the markets for the week ahead.
Let us know what you think in the comments below!
Disclaimer: The views and opinions expressed in this material do not constitute a recommendation by TrackRecord Pte. Ltd. that any particular investment, security, transaction or investment strategy is suitable for any specific person. No part of this material may be reproduced or transmitted in any form or by any means, electronic, mechanical, photocopying, recording, or otherwise, without prior written permission of TrackRecord Pte. Ltd