
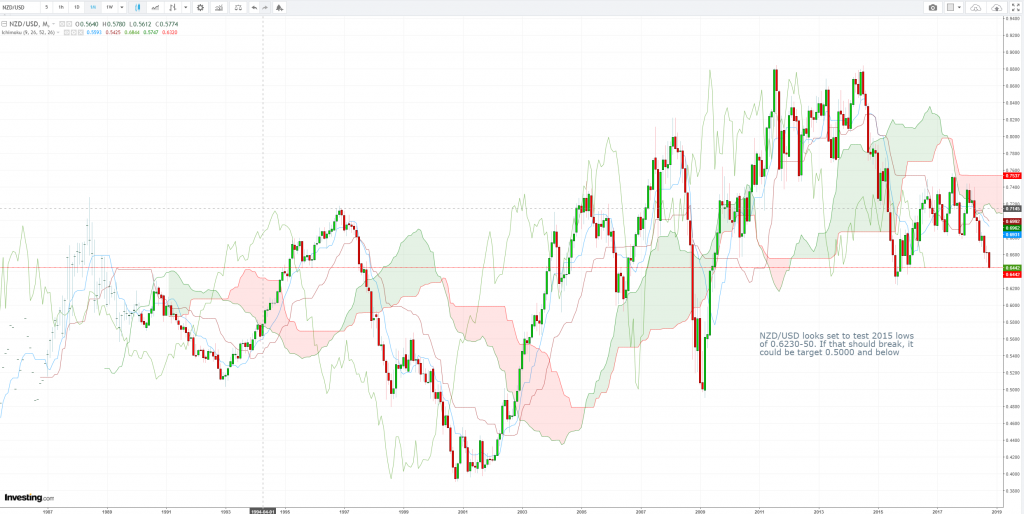
NZD/USD Monthly Candlesticks & Ichimoku Chart
NZD/USD looks set to test 2015’s lows of 0.6230-50. If that should break, it could be targeting 0.5000 and below.
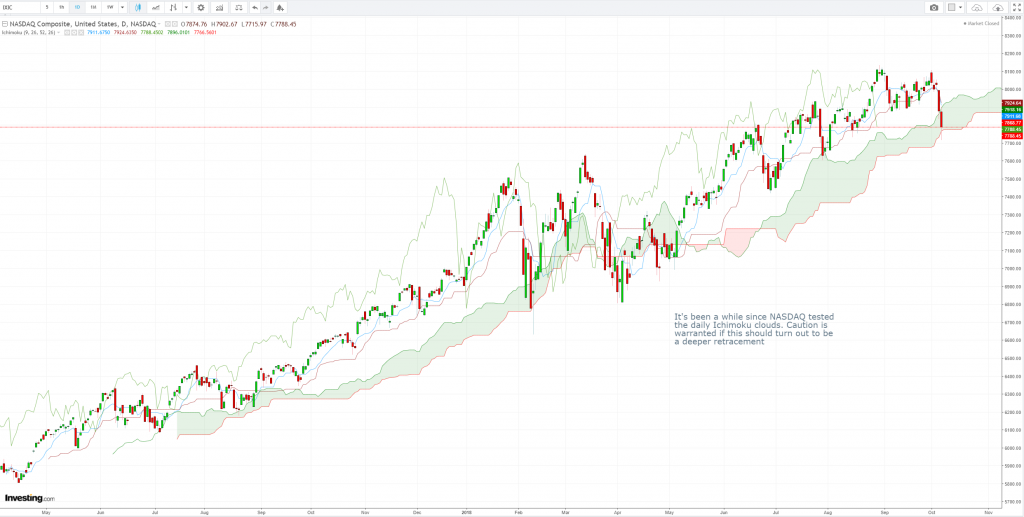
NASDAQ Index Daily Candlesticks & Ichimoku Chart
It’s been a while since NASDAQ tested the daily Ichimoku clouds. Caution is warranted if this should turn out to be a deeper retracement.
Vee, our Founder/CIO highlights patterns/formations on selected chart(s) every week which may have the potential to turn into trading opportunities. These charts are extracts of our weekly subscription product – “CIO’s Week Ahead Update” which provides analysis for the week ahead, first sent out on Monday of the week.
Let us know what you think in the comments below!
Disclaimer: The views and opinions expressed in this material do not constitute a recommendation by TrackRecord Pte. Ltd. that any particular investment, security, transaction or investment strategy is suitable for any specific person. No part of this material may be reproduced or transmitted in any form or by any means, electronic, mechanical, photocopying, recording, or otherwise, without prior written permission of TrackRecord Pte. Ltd