
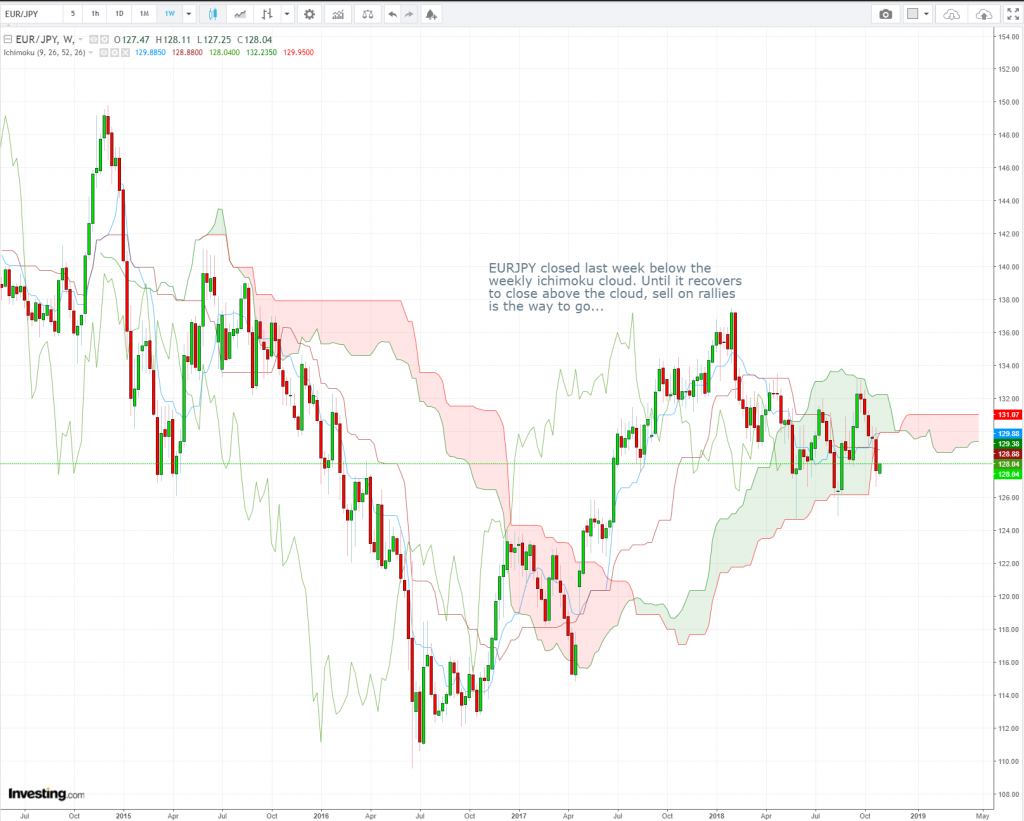
EUR/JPY Weekly Candlesticks & Ichimoku Chart SHORT
EUR/JPY closed last week below the weekly Ichimoku cloud. Until it recovers to close above the cloud, sell on rallies is the way to go.
NASDAQ Composite Index Weekly Candlesticks & Ichimoku Chart
The NASDAQ Composite Index has not traded below the weekly Ichimoku cloud since mid 2016. It is now trading near critical support levels. A close below the cloud will be quite damaging to the longer term technical picture.
Vee, our Founder/CIO highlights patterns/formations on selected chart(s) every week which may have the potential to turn into trading opportunities. These charts are extracts of our weekly subscription product – “CIO’s Week Ahead Update” which provides analysis for the week ahead, first sent out on Monday of the week.
Let us know what you think in the comments below!
Disclaimer: The views and opinions expressed in this material do not constitute a recommendation by TrackRecord Pte. Ltd. that any particular investment, security, transaction or investment strategy is suitable for any specific person. No part of this material may be reproduced or transmitted in any form or by any means, electronic, mechanical, photocopying, recording, or otherwise, without prior written permission of TrackRecord Pte. Ltd