
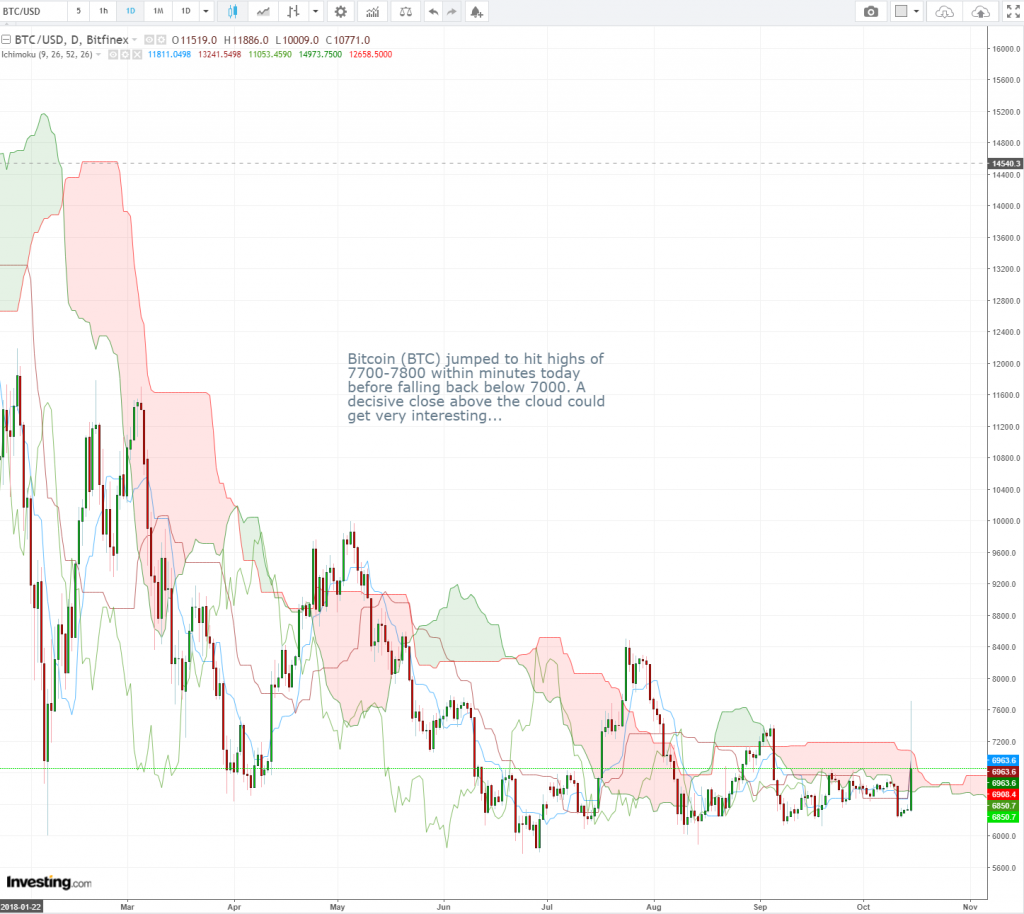
Bitcoin (BTC) Daily Candlesticks & Ichimoku Chart – LONG
Bitcoin (BTC) jumped to hit highs of 7700-7800 within minutes yesterday before falling back to below 7000. A decisive close above the cloud could get very interesting.
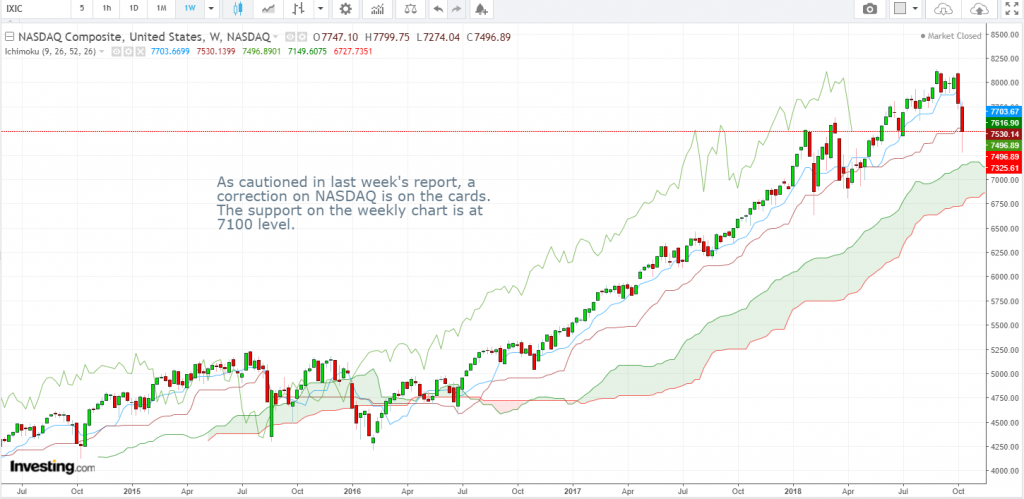
NASDAQ Index Weekly Candlesticks & Ichimoku Chart
As cautioned in last week’s report, a correction on NASDAQ is on the cards. The support on the weekly chart is at 7100 level.
Vee, our Founder/CIO highlights patterns/formations on selected chart(s) every week which may have the potential to turn into trading opportunities. These charts are extracts of our weekly subscription product – “CIO’s Week Ahead Update” which provides analysis for the week ahead, first sent out on Monday of the week.
Let us know what you think in the comments below!
Disclaimer: The views and opinions expressed in this material do not constitute a recommendation by TrackRecord Pte. Ltd. that any particular investment, security, transaction or investment strategy is suitable for any specific person. No part of this material may be reproduced or transmitted in any form or by any means, electronic, mechanical, photocopying, recording, or otherwise, without prior written permission of TrackRecord Pte. Ltd