Trade Opportunity: S&P500 index breaks and closes above the weekly ichimoku cloud for the first time this year.

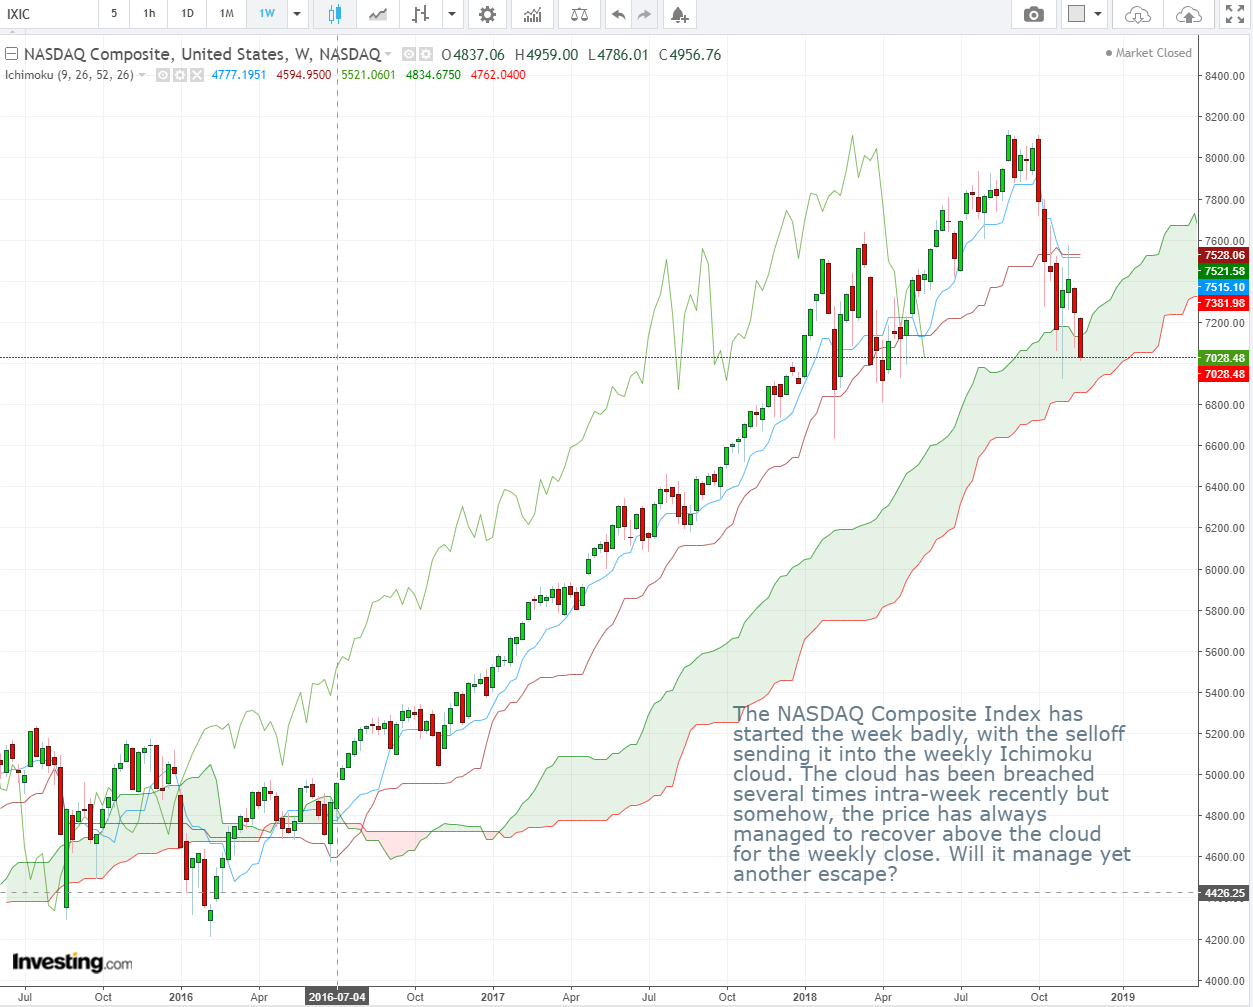
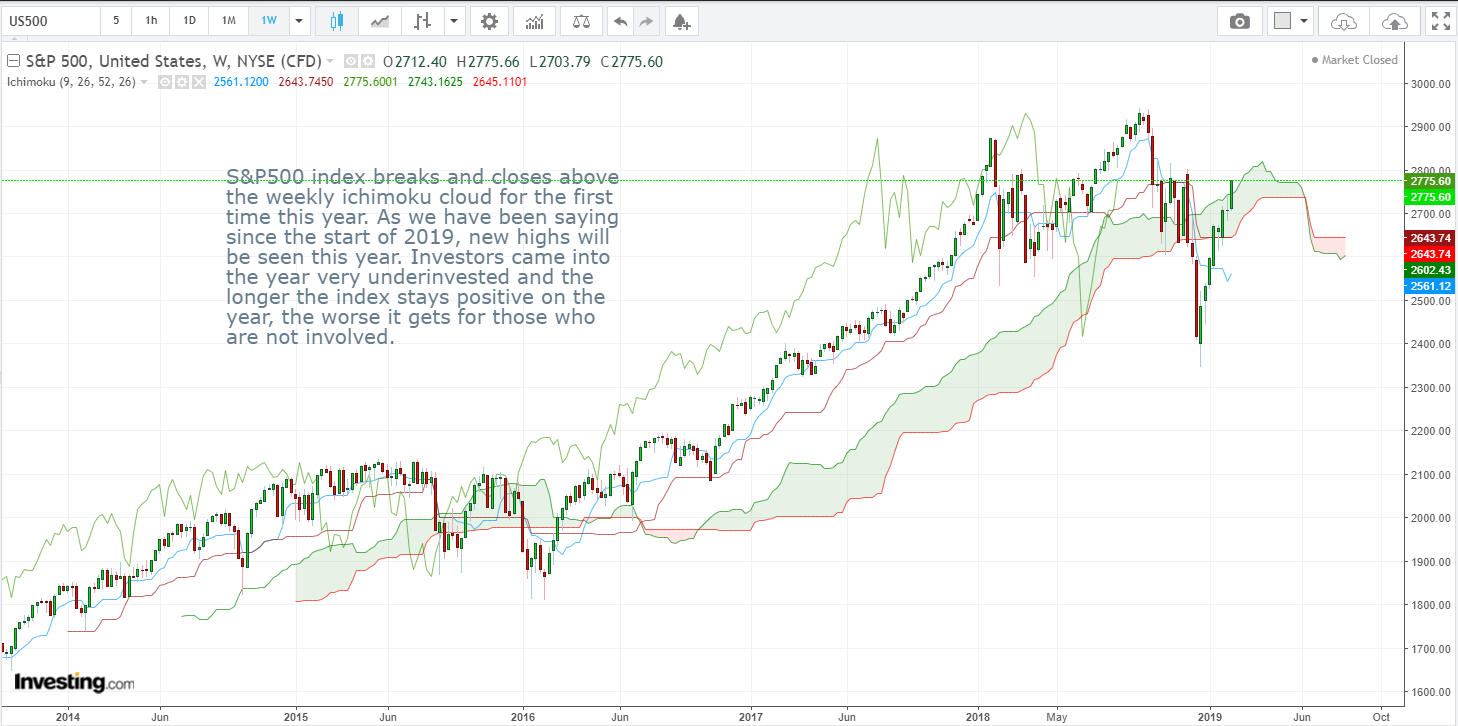
S&P500 Index Weekly Candlesticks & Ichimoku Chart: LONG

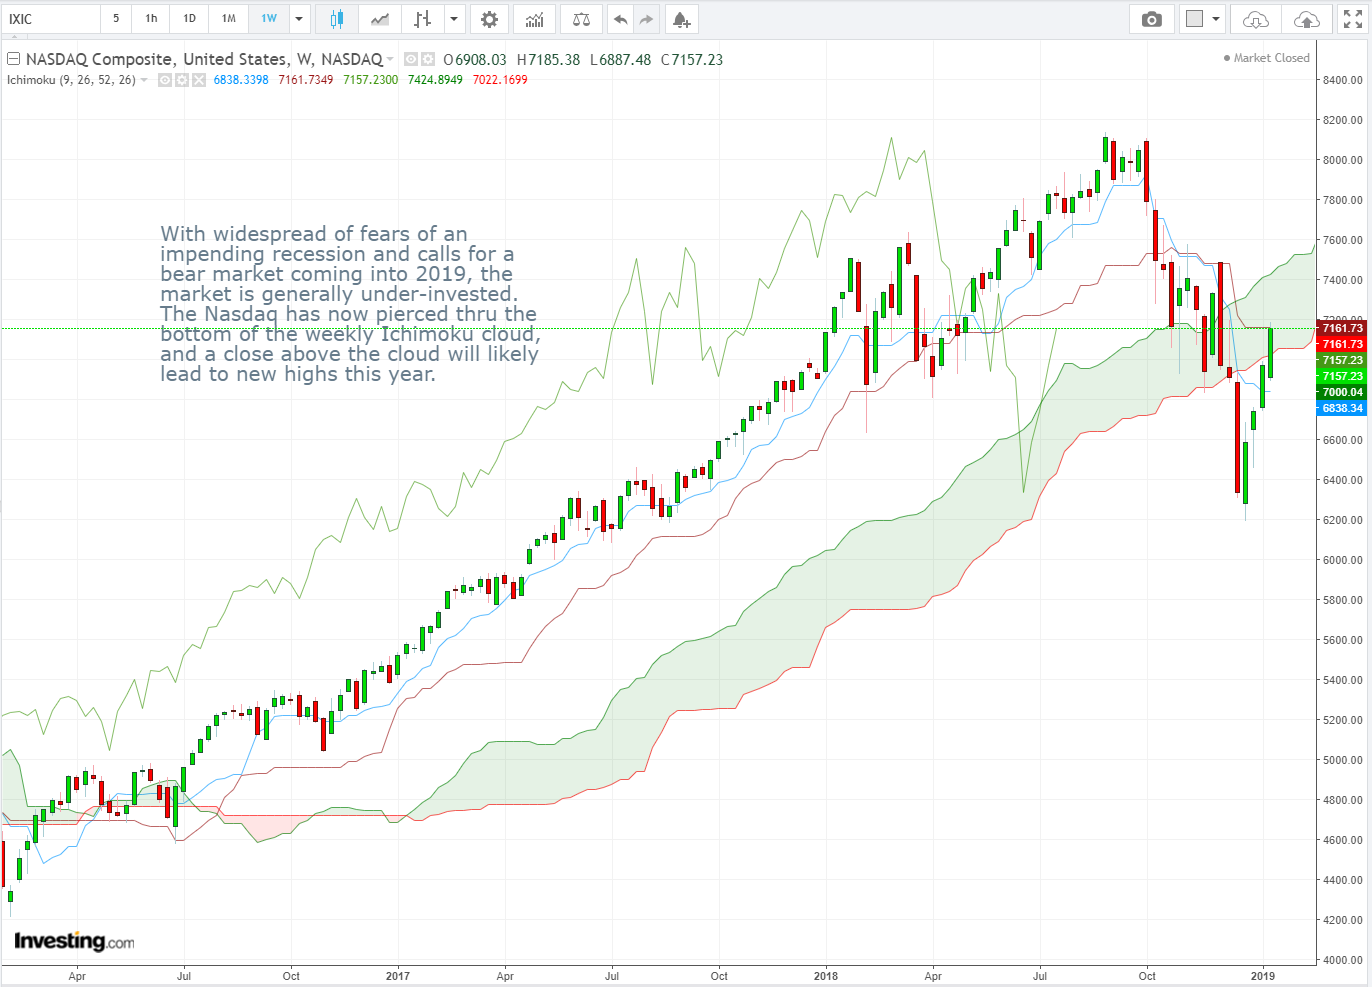
S&P500 index breaks and closes above the weekly ichimoku cloud for the first time this year. As we have been saying since the start of 2019, new highs will be seen this year. Investors came into the year very underinvested and the longer the index stays positive on the year, the worse it gets for those who are not involved.

Vee, our Founder/CIO highlights patterns/formations on selected chart(s) every week which may have the potential to turn into trading opportunities. These charts are first sent out on Monday of the week to members subscribed to THE LONG & SHORT OF IT, which helps you to filter out the noise and condense only what’s important in the markets for the week ahead.

Disclaimer: The views and opinions expressed in this material do not constitute a recommendation by TrackRecord Pte. Ltd. that any particular investment, security, transaction or investment strategy is suitable for any specific person. No part of this material may be reproduced or transmitted in any form or by any means, electronic, mechanical, photocopying, recording, or otherwise, without prior written permission of TrackRecord Pte. Ltd


Trade Opportunity: DXY – Since the surprisingly dovish stance taken by the Federal Reserve at the Jan FOMC meeting, the Dollar Index (DXY) has been on the rise.

US Dollar Index (DXY) Daily Candlesticks & Ichimoku Chart: LONG

Since the surprisingly dovish stance taken by the Federal Reserve at the Jan FOMC meeting, the Dollar Index (DXY) has been on the rise. Price action is especially encouraging against the EUR. If US rates are lower and growth prospects deemed discouraging by the market, what’s driving the USD strength? More importantly, is there any reason to not get involved?

Vee, our Founder/CIO highlights patterns/formations on selected chart(s) every week which may have the potential to turn into trading opportunities. These charts are first sent out on Monday of the week to members subscribed to THE LONG & SHORT OF IT, which helps you to filter out the noise and condense only what’s important in the markets for the week ahead.

Disclaimer: The views and opinions expressed in this material do not constitute a recommendation by TrackRecord Pte. Ltd. that any particular investment, security, transaction or investment strategy is suitable for any specific person. No part of this material may be reproduced or transmitted in any form or by any means, electronic, mechanical, photocopying, recording, or otherwise, without prior written permission of TrackRecord Pte. Ltd

Trade Opportunity: USD/CNH seems poised to test 6.35 levels

USD/CNH Daily Candlesticks & Ichimoku Chart  SHORT 

USD/CNH seems poised to test 6.35 levels. Positive developments from the trade talks should do it!


Vee, our Founder/CIO highlights patterns/formations on selected chart(s) every week which may have the potential to turn into trading opportunities. These charts are first sent out on Monday of the week to members subscribed to THE LONG & SHORT OF IT, which helps you to filter out the noise and condense only what’s important in the markets for the week ahead.

Disclaimer: The views and opinions expressed in this material do not constitute a recommendation by TrackRecord Pte. Ltd. that any particular investment, security, transaction or investment strategy is suitable for any specific person. No part of this material may be reproduced or transmitted in any form or by any means, electronic, mechanical, photocopying, recording, or otherwise, without prior written permission of TrackRecord Pte. Ltd

Trade Opportunity: With widespread of fears of an impending recession and calls for a bear market coming into 2019, the market is generally under-invested.

NASDAQ Composite Index Weekly Candlesticks & Ichimoku Chart

With widespread of fears of an impending recession and calls for a bear market coming into 2019, the market is generally under-invested. The Nasdaq has now pierced through the bottom of the weekly ichimoku cloud and a close above the cloud will likely lead to new highs this year.

Vee, our Founder/CIO highlights patterns/formations on selected chart(s) every week which may have the potential to turn into trading opportunities. These charts are first sent out on Monday of the week to members subscribed to THE LONG & SHORT OF IT, which helps you to filter out the noise and condense only what’s important in the markets for the week ahead.

Disclaimer: The views and opinions expressed in this material do not constitute a recommendation by TrackRecord Pte. Ltd. that any particular investment, security, transaction or investment strategy is suitable for any specific person. No part of this material may be reproduced or transmitted in any form or by any means, electronic, mechanical, photocopying, recording, or otherwise, without prior written permission of TrackRecord Pte. Ltd

Trade Opportunities: Bitcoin was stealthily trying to break above the daily ichimoku cloud but seems to have failed for now

BTC/USD Daily Candlesticks & Ichimoku Chart

Bitcoin was stealthily trying to break above the daily ichimoku cloud but seems to have failed for now. A decisive break above will rekindle interest in the market, but for now, the winter continues.


Vee, our Founder/CIO highlights patterns/formations on selected chart(s) every week which may have the potential to turn into trading opportunities. These charts are first sent out on Monday of the week to members subscribed to THE LONG & SHORT OF IT, which helps you to filter out the noise and condense only what’s important in the markets for the week ahead.

Disclaimer: The views and opinions expressed in this material do not constitute a recommendation by TrackRecord Pte. Ltd. that any particular investment, security, transaction or investment strategy is suitable for any specific person. No part of this material may be reproduced or transmitted in any form or by any means, electronic, mechanical, photocopying, recording, or otherwise, without prior written permission of TrackRecord Pte. Ltd

Trade Opportunities: EURCAD, AUDUSD

AUD/USD Weekly Candlesticks & Ichimoku Chart    LONG

Strong candle on the weekly chart. Unless the lows are violated, dips should be bought going forward.

EUR/CAD Weekly Candlesticks & Ichimoku Chart  SHORT

Strong reversal candle on the weekly chart and price is now firmly below the weekly cloud. Retracements towards the bottom of the cloud would be good opportunities to initiate shorts.


Vee, our Founder/CIO highlights patterns/formations on selected chart(s) every week which may have the potential to turn into trading opportunities. These charts are first sent out on Monday of the week to members subscribed to THE LONG & SHORT OF IT, which helps you to filter out the noise and condense only what’s important in the markets for the week ahead.

Disclaimer: The views and opinions expressed in this material do not constitute a recommendation by TrackRecord Pte. Ltd. that any particular investment, security, transaction or investment strategy is suitable for any specific person. No part of this material may be reproduced or transmitted in any form or by any means, electronic, mechanical, photocopying, recording, or otherwise, without prior written permission of TrackRecord Pte. Ltd

Trade Opportunity: NASDAQ

Nasdaq Index (IXIC) Weekly Candlesticks & Ichimoku Chart   LONG


Vee, our Founder/CIO highlights patterns/formations on selected chart(s) every week which may have the potential to turn into trading opportunities. These charts are first sent out on Monday of the week to members of our weekly subscription product – “CIO’s Week Ahead Update”, which helps to filter out the noise and condense only what’s important in the markets for the week ahead.

Disclaimer: The views and opinions expressed in this material do not constitute a recommendation by TrackRecord Pte. Ltd. that any particular investment, security, transaction or investment strategy is suitable for any specific person. No part of this material may be reproduced or transmitted in any form or by any means, electronic, mechanical, photocopying, recording, or otherwise, without prior written permission of TrackRecord Pte. Ltd

Trade Opportunities: AUDUSD, US 10YT

AUD/USD Daily Candlesticks & Ichimoku Chart   LONG 
If the support on the daily Ichimoku chart holds, it will be worth a shot to go long AUD/USD again soon…


US Treasury 10-Year Yield Weekly Candlesticks & Ichimoku Chart
US Treasury 10yr Yield is testing the cloud support on the weekly Ichimoku chart. A breach of this will increase the enthusiasm of the bears…


Vee, our Founder/CIO highlights patterns/formations on selected chart(s) every week which may have the potential to turn into trading opportunities. These charts are first sent out on Monday of the week to members of our weekly subscription product – “CIO’s Week Ahead Update”, which helps to filter out the noise and condense only what’s important in the markets for the week ahead.

Disclaimer: The views and opinions expressed in this material do not constitute a recommendation by TrackRecord Pte. Ltd. that any particular investment, security, transaction or investment strategy is suitable for any specific person. No part of this material may be reproduced or transmitted in any form or by any means, electronic, mechanical, photocopying, recording, or otherwise, without prior written permission of TrackRecord Pte. Ltd

Trade Opportunities: NASDAQ, EURCAD

NASDAQ Composite Index (IXIC) Weekly Candlesticks & Ichimoku Chart  LONG 
The NASDAQ Composite Index has yet again failed to break below and managed to recover to close above the weekly ichimoku cloud. With the 90-day truce in the Trade War, it is now likely to trade higher into the end of the year.


EUR/CAD Daily Candlesticks & Ichimoku Chart  SHORT 
With EUR/CAD twice failing to sustain closes above the daily Ichimoku clouds, the time to re-initiate short positions on this pair could be soon at hand!


Vee, our Founder/CIO highlights patterns/formations on selected chart(s) every week which may have the potential to turn into trading opportunities. These charts are first sent out on Monday of the week to members of our weekly subscription product – “CIO’s Week Ahead Update”, which helps to filter out the noise and condense only what’s important in the markets for the week ahead.

Disclaimer: The views and opinions expressed in this material do not constitute a recommendation by TrackRecord Pte. Ltd. that any particular investment, security, transaction or investment strategy is suitable for any specific person. No part of this material may be reproduced or transmitted in any form or by any means, electronic, mechanical, photocopying, recording, or otherwise, without prior written permission of TrackRecord Pte. Ltd

Trade Opportunities: USDJPY, NASDAQ

USD/JPY Daily Candlesticks & Ichimoku Chart   SHORT 
USD/JPY has broken into the daily Ichimoku cloud. Looking to sell rallies if opportunities should arise.


NASDAQ Composite Index (IXIC) Weekly Candlesticks & Ichimoku Chart
The NASDAQ Composite Index has started the week badly, with the selloff sending it into the weekly Ichimoku cloud. The cloud has been breached several times intra-week recently but somehow, the price has always managed to recover above the clouds.


Vee, our Founder/CIO highlights patterns/formations on selected chart(s) every week which may have the potential to turn into trading opportunities. These charts are first sent out on Monday of the week to members of our weekly subscription product – “CIO’s Week Ahead Update”, which helps to filter out the noise and condense only what’s important in the markets for the week ahead.

Let us know what you think in the comments below!

Disclaimer: The views and opinions expressed in this material do not constitute a recommendation by TrackRecord Pte. Ltd. that any particular investment, security, transaction or investment strategy is suitable for any specific person. No part of this material may be reproduced or transmitted in any form or by any means, electronic, mechanical, photocopying, recording, or otherwise, without prior written permission of TrackRecord Pte. Ltd