
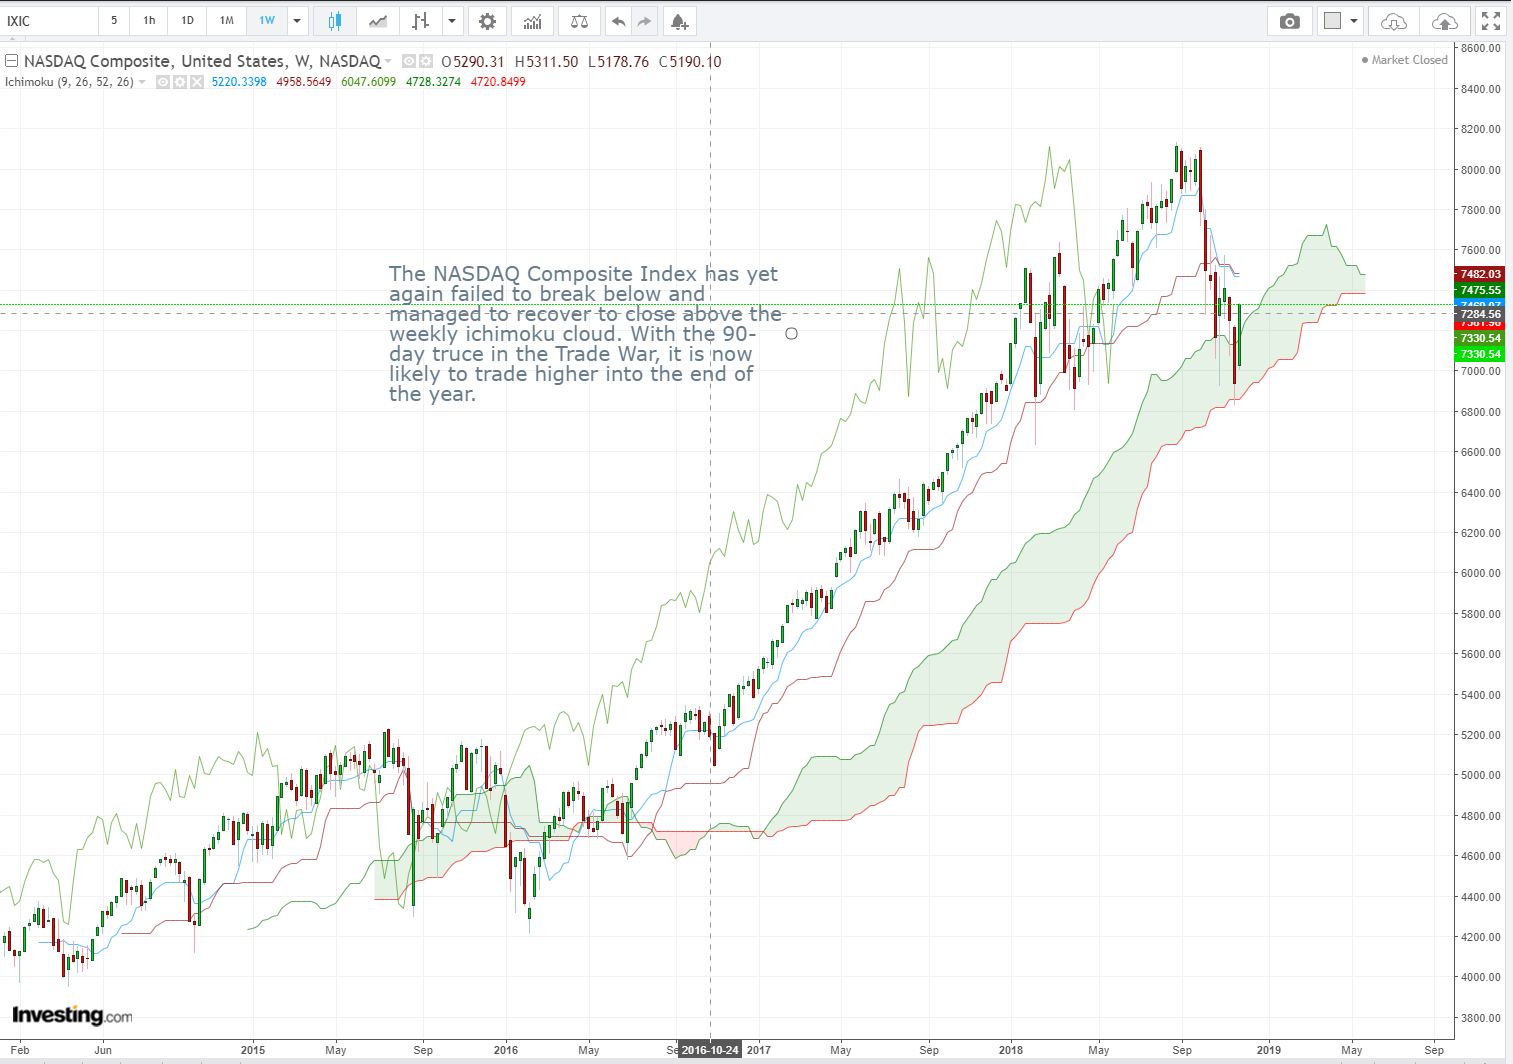
NASDAQ Composite Index (IXIC) Weekly Candlesticks & Ichimoku Chart LONG
The NASDAQ Composite Index has yet again failed to break below and managed to recover to close above the weekly ichimoku cloud. With the 90-day truce in the Trade War, it is now likely to trade higher into the end of the year.
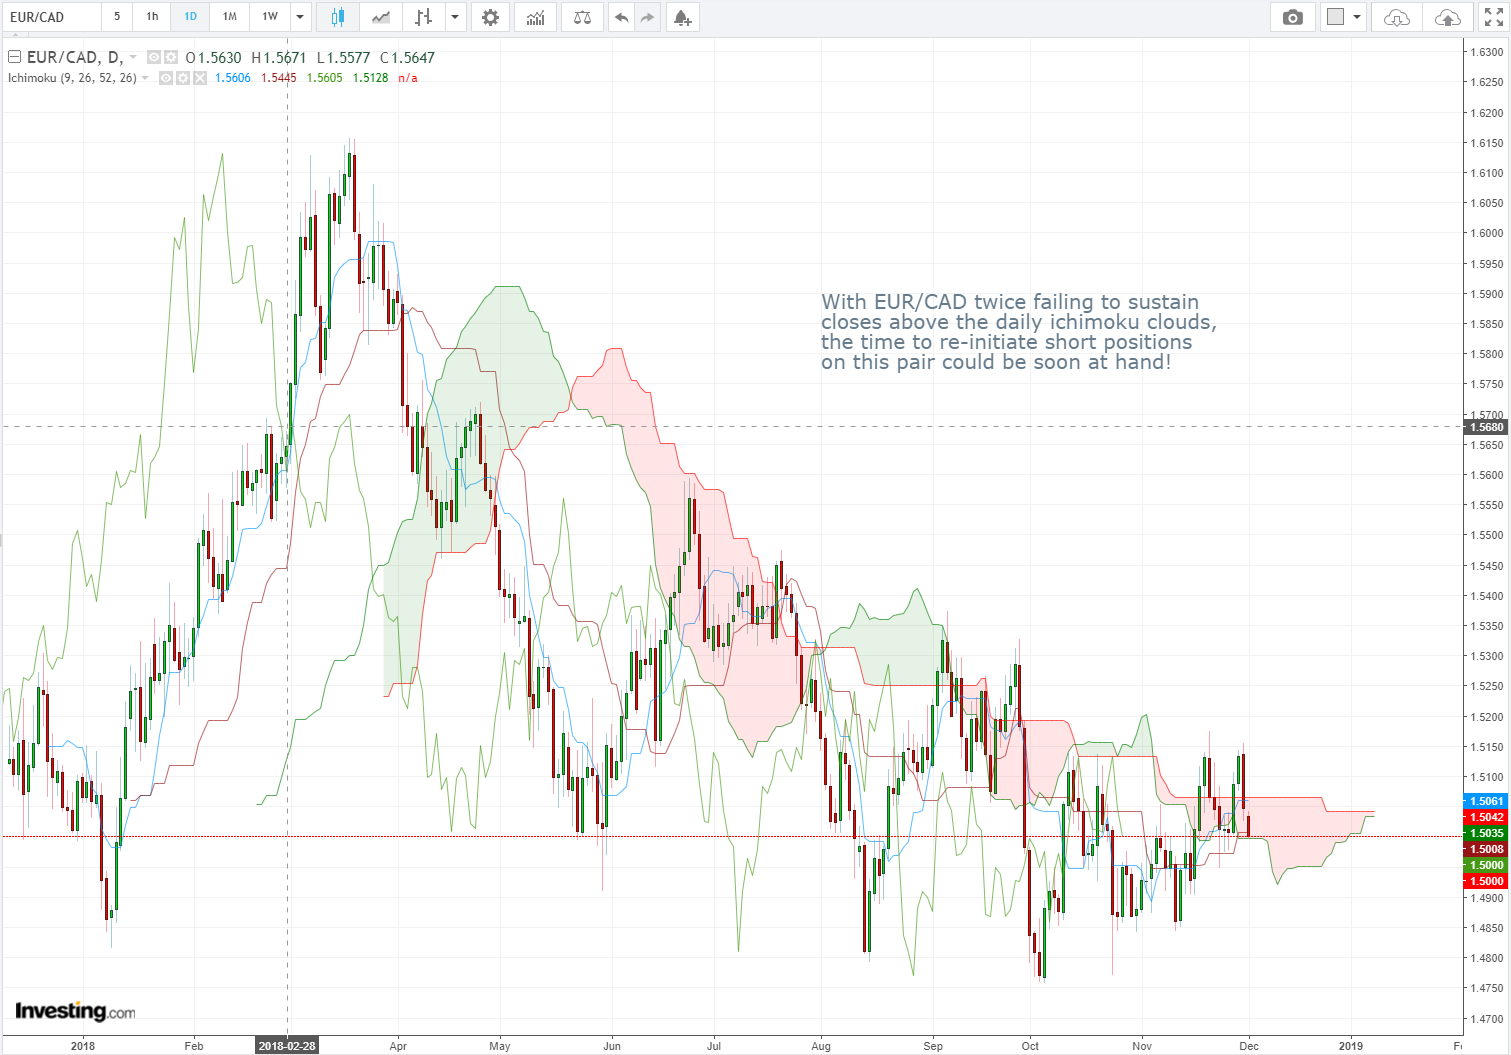
EUR/CAD Daily Candlesticks & Ichimoku Chart SHORT
With EUR/CAD twice failing to sustain closes above the daily Ichimoku clouds, the time to re-initiate short positions on this pair could be soon at hand!
Vee, our Founder/CIO highlights patterns/formations on selected chart(s) every week which may have the potential to turn into trading opportunities. These charts are first sent out on Monday of the week to members of our weekly subscription product – “CIO’s Week Ahead Update”, which helps to filter out the noise and condense only what’s important in the markets for the week ahead.
Disclaimer: The views and opinions expressed in this material do not constitute a recommendation by TrackRecord Pte. Ltd. that any particular investment, security, transaction or investment strategy is suitable for any specific person. No part of this material may be reproduced or transmitted in any form or by any means, electronic, mechanical, photocopying, recording, or otherwise, without prior written permission of TrackRecord Pte. Ltd