Trade Opportunity: EURCAD break new lows

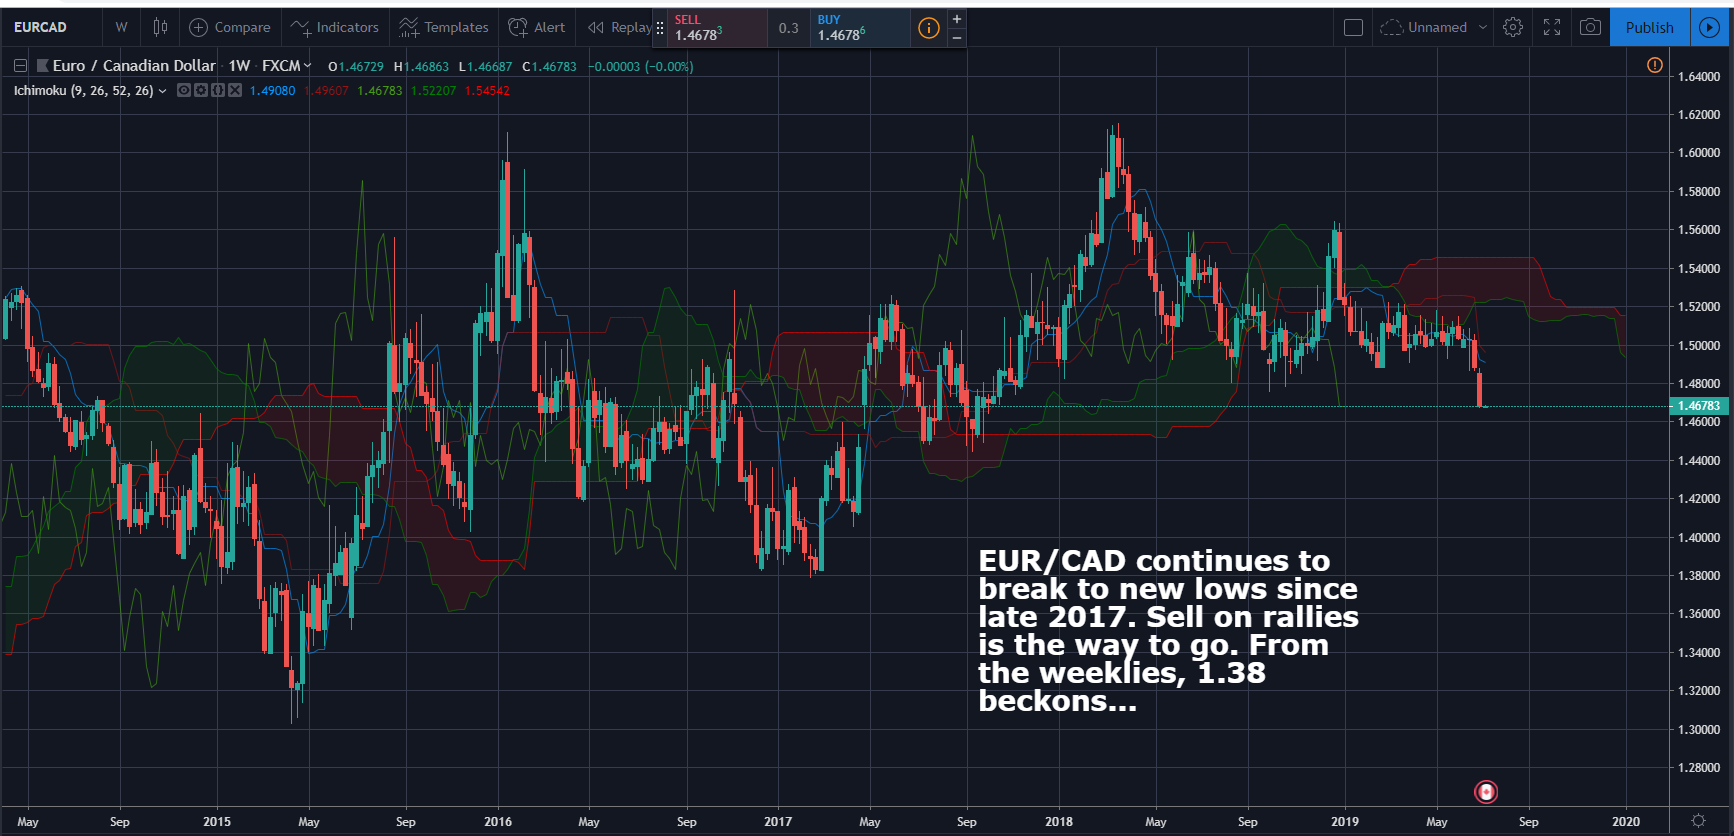
EUR/CAD Weekly Candlesticks & Ichimoku Chart  – SHORT

EUR/CAD continues to break to new lows since late 2017. Sell on rallies is the way to go. From the weeklies, 1.38 beckons…

Vee, our Founder/CIO highlights patterns/formations on selected chart(s) every week which may have the potential to turn into trading opportunities. These charts are first sent out on Monday of the week to members subscribed to THE LONG & SHORT OF IT, which helps you to filter out the noise and condense only what’s important in the markets for the week ahead.

Disclaimer: The views and opinions expressed in this material do not constitute a recommendation by TrackRecord Pte. Ltd. that any particular investment, security, transaction or investment strategy is suitable for any specific person. No part of this material may be reproduced or transmitted in any form or by any means, electronic, mechanical, photocopying, recording, or otherwise, without prior written permission of TrackRecord Pte. Ltd

Trade Opportunity: USD/TRY – Adding to shorts

USD/TRY Daily Candlesticks & Ichimoku Chart  – SHORT

If USD/TRY closes decisively below the daily ichimoku cloud, we will be looking to add to our shorts (established at the end of May) on any future retracements.


Vee, our Founder/CIO highlights patterns/formations on selected chart(s) every week which may have the potential to turn into trading opportunities. These charts are first sent out on Monday of the week to members subscribed to THE LONG & SHORT OF IT, which helps you to filter out the noise and condense only what’s important in the markets for the week ahead.

Disclaimer: The views and opinions expressed in this material do not constitute a recommendation by TrackRecord Pte. Ltd. that any particular investment, security, transaction or investment strategy is suitable for any specific person. No part of this material may be reproduced or transmitted in any form or by any means, electronic, mechanical, photocopying, recording, or otherwise, without prior written permission of TrackRecord Pte. Ltd

Trade Opportunity: Gold – Broken out above resistance at 1365 – 1375

XAUUSD (Gold) Weekly Candlesticks & Ichimoku Chart – LONG

Gold have broken out decisively on the weekly charts above resistance at 1365 – 1375. With most of the major central banks dovish and ready to inject stimulus, hard assets will continue to do well against fiat money. Buy on dips is the mode to be in!

Vee, our Founder/CIO highlights patterns/formations on selected chart(s) every week which may have the potential to turn into trading opportunities. These charts are first sent out on Monday of the week to members subscribed to THE LONG & SHORT OF IT, which helps you to filter out the noise and condense only what’s important in the markets for the week ahead.

Disclaimer: The views and opinions expressed in this material do not constitute a recommendation by TrackRecord Pte. Ltd. that any particular investment, security, transaction or investment strategy is suitable for any specific person. No part of this material may be reproduced or transmitted in any form or by any means, electronic, mechanical, photocopying, recording, or otherwise, without prior written permission of TrackRecord Pte. Ltd

Trade Opportunity: Facebook – Strong close above cloud signals…

Facebook (FB) Stock Weekly Candlesticks & Ichimoku Chart – LONG

Facebook stock failed to break below the weekly Ichimoku cloud and seems to have staged a strong close above it. With 159 as the support, new highs could be reached in the weeks to come.


Vee, our Founder/CIO highlights patterns/formations on selected chart(s) every week which may have the potential to turn into trading opportunities. These charts are first sent out on Monday of the week to members subscribed to THE LONG & SHORT OF IT, which helps you to filter out the noise and condense only what’s important in the markets for the week ahead.

Disclaimer: The views and opinions expressed in this material do not constitute a recommendation by TrackRecord Pte. Ltd. that any particular investment, security, transaction or investment strategy is suitable for any specific person. No part of this material may be reproduced or transmitted in any form or by any means, electronic, mechanical, photocopying, recording, or otherwise, without prior written permission of TrackRecord Pte. Ltd

Trade Opportunity: Support for S&P500 held

S&P500 Index Weekly Candlesticks & Ichimoku Chart – LONG

Support for S&P500 Index held on the weekly Ichimoku cloud chart and the week closed with a bullish candle. New highs are on the cards.

Vee, our Founder/CIO highlights patterns/formations on selected chart(s) every week which may have the potential to turn into trading opportunities. These charts are first sent out on Monday of the week to members subscribed to THE LONG & SHORT OF IT, which helps you to filter out the noise and condense only what’s important in the markets for the week ahead.

Disclaimer: The views and opinions expressed in this material do not constitute a recommendation by TrackRecord Pte. Ltd. that any particular investment, security, transaction or investment strategy is suitable for any specific person. No part of this material may be reproduced or transmitted in any form or by any means, electronic, mechanical, photocopying, recording, or otherwise, without prior written permission of TrackRecord Pte. Ltd

Trade Opportunity: USDJPY broken decisively below

USD/JPY Weekly Candlesticks & Ichimoku Chart – SHORT

USD/JPY has broken decisively below the weekly ichimoku clouds. 109.50-60 should be a good resistance to initiate shorts against on any bounce.

Vee, our Founder/CIO highlights patterns/formations on selected chart(s) every week which may have the potential to turn into trading opportunities. These charts are first sent out on Monday of the week to members subscribed to THE LONG & SHORT OF IT, which helps you to filter out the noise and condense only what’s important in the markets for the week ahead.

Disclaimer: The views and opinions expressed in this material do not constitute a recommendation by TrackRecord Pte. Ltd. that any particular investment, security, transaction or investment strategy is suitable for any specific person. No part of this material may be reproduced or transmitted in any form or by any means, electronic, mechanical, photocopying, recording, or otherwise, without prior written permission of TrackRecord Pte. Ltd


Trade Opportunity: Bitcoin – Next phase of the “bubble” market has begun

BTC/USD (Bitcoin) Weekly Candlesticks & Ichimoku Chart  – LONG

BTC is making a strong move into the weekly ichimoku cloud. The next phase of the “bubble” market has begun. As long as support of 7000 holds, new highs could be on the cards soon!

Vee, our Founder/CIO highlights patterns/formations on selected chart(s) every week which may have the potential to turn into trading opportunities. These charts are first sent out on Monday of the week to members subscribed to THE LONG & SHORT OF IT, which helps you to filter out the noise and condense only what’s important in the markets for the week ahead.

Disclaimer: The views and opinions expressed in this material do not constitute a recommendation by TrackRecord Pte. Ltd. that any particular investment, security, transaction or investment strategy is suitable for any specific person. No part of this material may be reproduced or transmitted in any form or by any means, electronic, mechanical, photocopying, recording, or otherwise, without prior written permission of TrackRecord Pte. Ltd

Trade Opportunity: Gold – increasingly bearish outlook

XAU/USD (Gold) Daily Candlesticks & Ichimoku Chart – SHORT

Gold looks increasingly bearish on the daily chart. Support at 1265 should be under threat soon, and if that should break decisively, the next target would be 1190 – 1200.

Vee, our Founder/CIO highlights patterns/formations on selected chart(s) every week which may have the potential to turn into trading opportunities. These charts are first sent out on Monday of the week to members subscribed to THE LONG & SHORT OF IT, which helps you to filter out the noise and condense only what’s important in the markets for the week ahead.

Disclaimer: The views and opinions expressed in this material do not constitute a recommendation by TrackRecord Pte. Ltd. that any particular investment, security, transaction or investment strategy is suitable for any specific person. No part of this material may be reproduced or transmitted in any form or by any means, electronic, mechanical, photocopying, recording, or otherwise, without prior written permission of TrackRecord Pte. Ltd

Trade Opportunity: Trump tweets on the Trade War is driving the stock market correction

Nasdaq Composite Weekly Candlesticks & Ichimoku Chart  – LONG

Trump tweets on the Trade War is driving the stock market correction. Fundamentals and the underinvestment of the market at large remain relatively unchanged. A correction to the 7600s on the index will be a good level to consider getting involved.

Vee, our Founder/CIO highlights patterns/formations on selected chart(s) every week which may have the potential to turn into trading opportunities. These charts are first sent out on Monday of the week to members subscribed to THE LONG & SHORT OF IT, which helps you to filter out the noise and condense only what’s important in the markets for the week ahead.

Disclaimer: The views and opinions expressed in this material do not constitute a recommendation by TrackRecord Pte. Ltd. that any particular investment, security, transaction or investment strategy is suitable for any specific person. No part of this material may be reproduced or transmitted in any form or by any means, electronic, mechanical, photocopying, recording, or otherwise, without prior written permission of TrackRecord Pte. Ltd

Trade Opportunity: USD/KRW breaking 2yr highs strongly may be the starts of a major USD move

USD/KRW (Korean Won) Weekly Candlesticks & Ichimoku Chart – LONG

USD/KRW breaking 2yr highs strongly may be the start of a major USD move. From the chart, 1210 is the next target.

Vee, our Founder/CIO highlights patterns/formations on selected chart(s) every week which may have the potential to turn into trading opportunities. These charts are first sent out on Monday of the week to members subscribed to THE LONG & SHORT OF IT, which helps you to filter out the noise and condense only what’s important in the markets for the week ahead.

Disclaimer: The views and opinions expressed in this material do not constitute a recommendation by TrackRecord Pte. Ltd. that any particular investment, security, transaction or investment strategy is suitable for any specific person. No part of this material may be reproduced or transmitted in any form or by any means, electronic, mechanical, photocopying, recording, or otherwise, without prior written permission of TrackRecord Pte. Ltd