
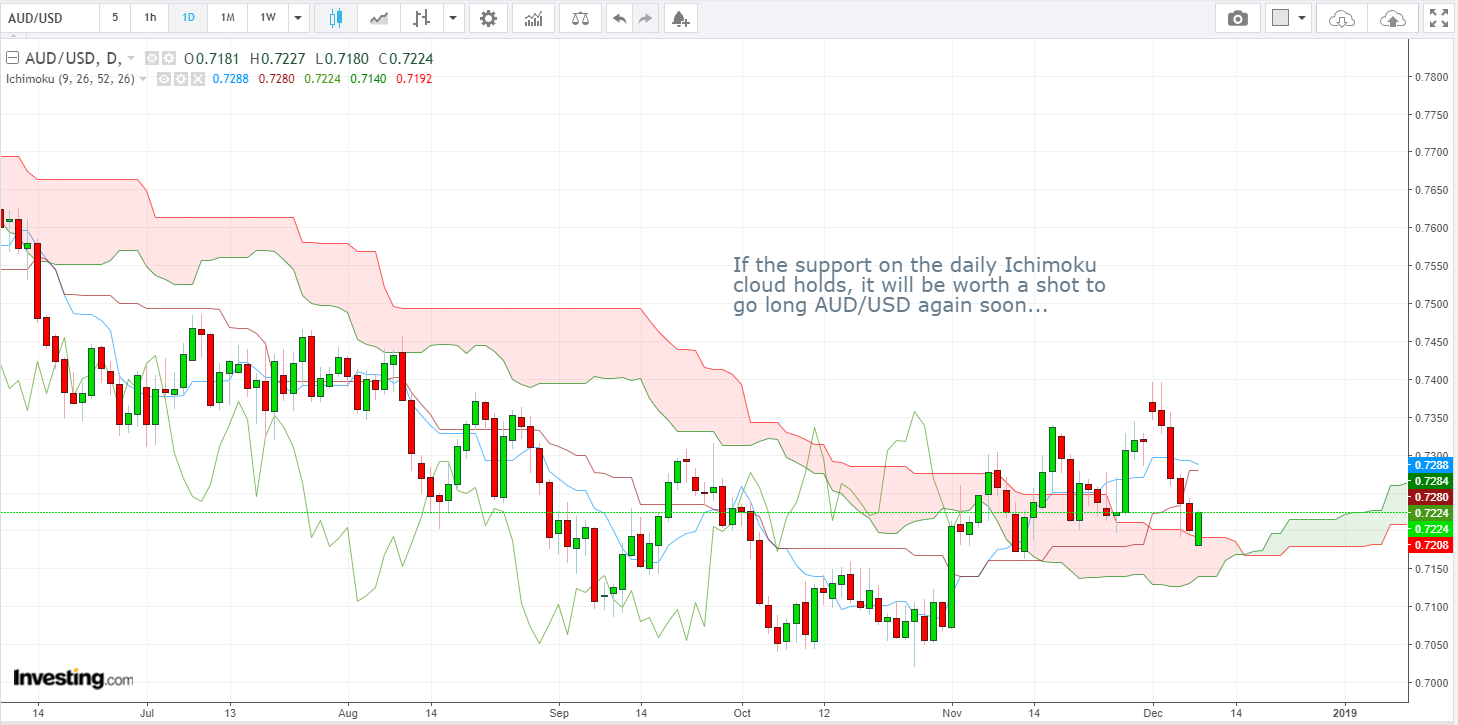
AUD/USD Daily Candlesticks & Ichimoku Chart LONG
If the support on the daily Ichimoku chart holds, it will be worth a shot to go long AUD/USD again soon…
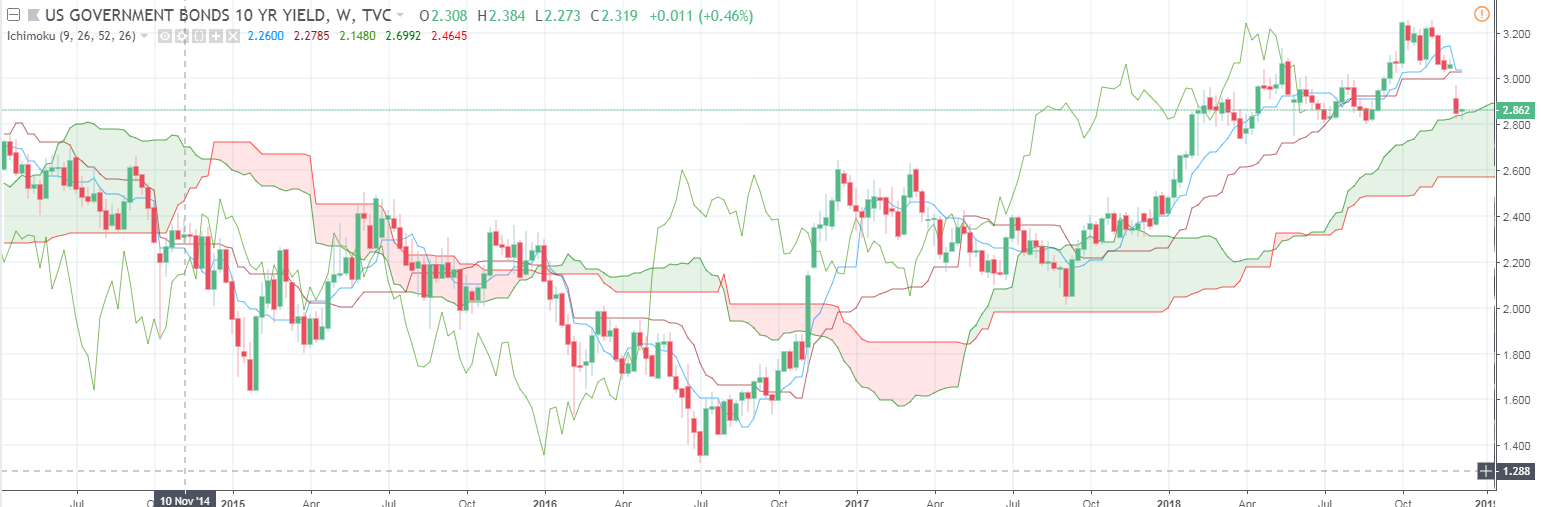
US Treasury 10-Year Yield Weekly Candlesticks & Ichimoku Chart
US Treasury 10yr Yield is testing the cloud support on the weekly Ichimoku chart. A breach of this will increase the enthusiasm of the bears…
Vee, our Founder/CIO highlights patterns/formations on selected chart(s) every week which may have the potential to turn into trading opportunities. These charts are first sent out on Monday of the week to members of our weekly subscription product – “CIO’s Week Ahead Update”, which helps to filter out the noise and condense only what’s important in the markets for the week ahead.
Disclaimer: The views and opinions expressed in this material do not constitute a recommendation by TrackRecord Pte. Ltd. that any particular investment, security, transaction or investment strategy is suitable for any specific person. No part of this material may be reproduced or transmitted in any form or by any means, electronic, mechanical, photocopying, recording, or otherwise, without prior written permission of TrackRecord Pte. Ltd