Trade Opportunity: USD/KRW breaking 2yr highs strongly may be the starts of a major USD move

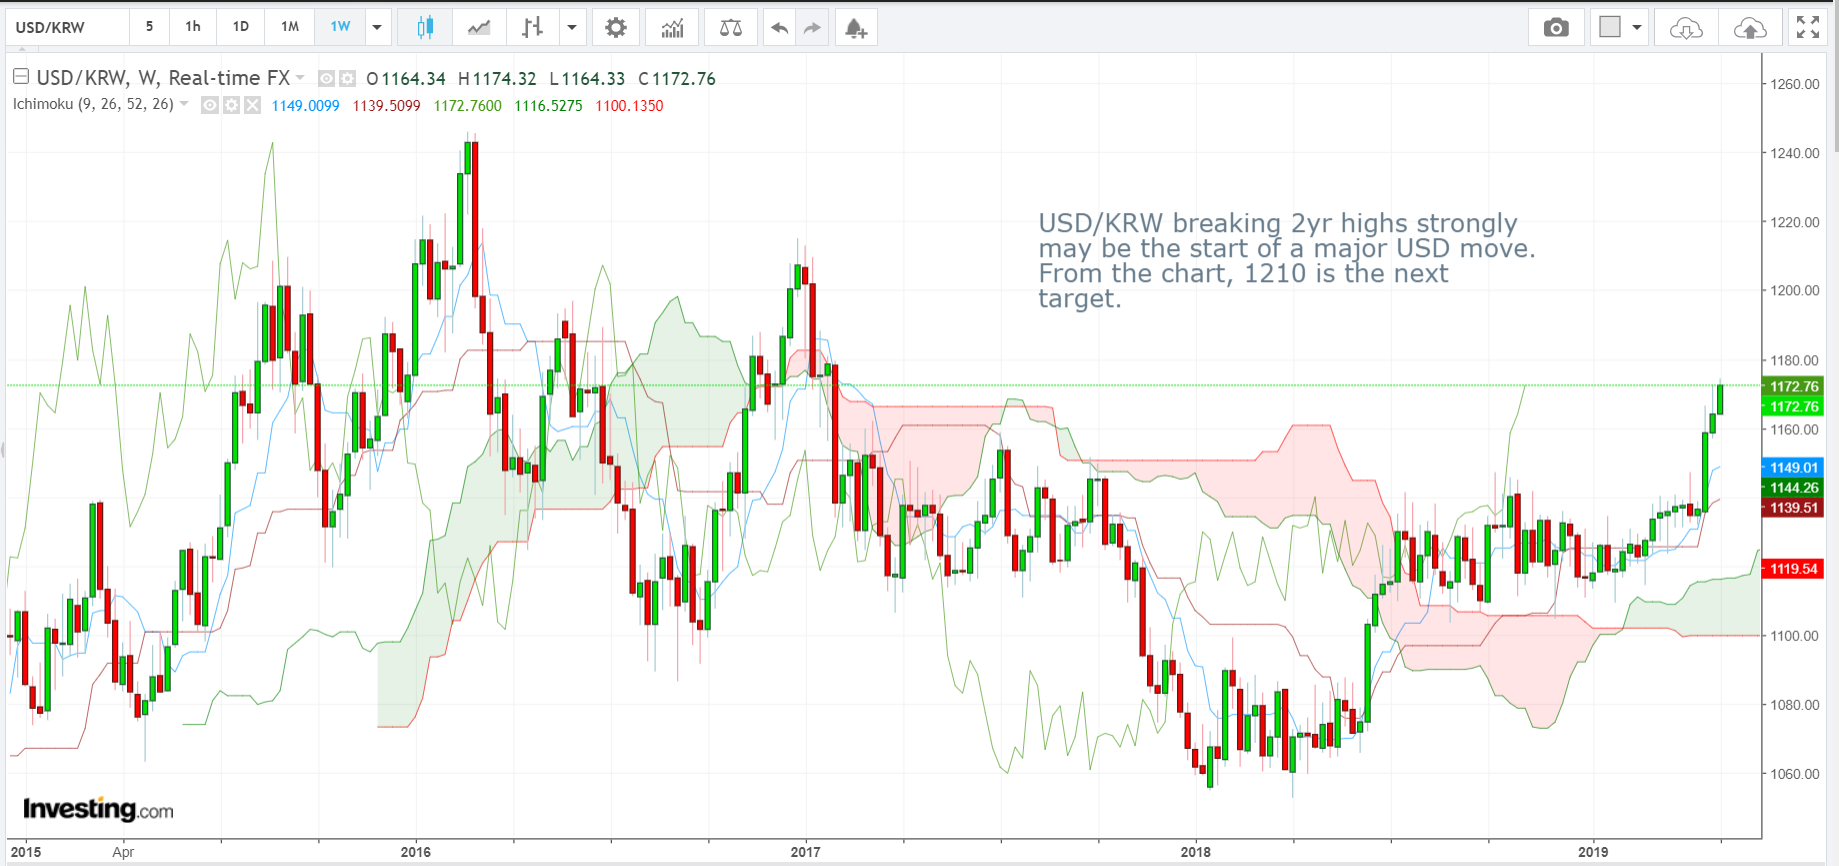
USD/KRW (Korean Won) Weekly Candlesticks & Ichimoku Chart – LONG

USD/KRW breaking 2yr highs strongly may be the start of a major USD move. From the chart, 1210 is the next target.
Vee, our Founder/CIO highlights patterns/formations on selected chart(s) every week which may have the potential to turn into trading opportunities. These charts are first sent out on Monday of the week to members subscribed to THE LONG & SHORT OF IT, which helps you to filter out the noise and condense only what’s important in the markets for the week ahead.

Disclaimer: The views and opinions expressed in this material do not constitute a recommendation by TrackRecord Pte. Ltd. that any particular investment, security, transaction or investment strategy is suitable for any specific person. No part of this material may be reproduced or transmitted in any form or by any means, electronic, mechanical, photocopying, recording, or otherwise, without prior written permission of TrackRecord Pte. Ltd

Trade Opportunities: Any pullbacks should be taken as opportunities to get involved.

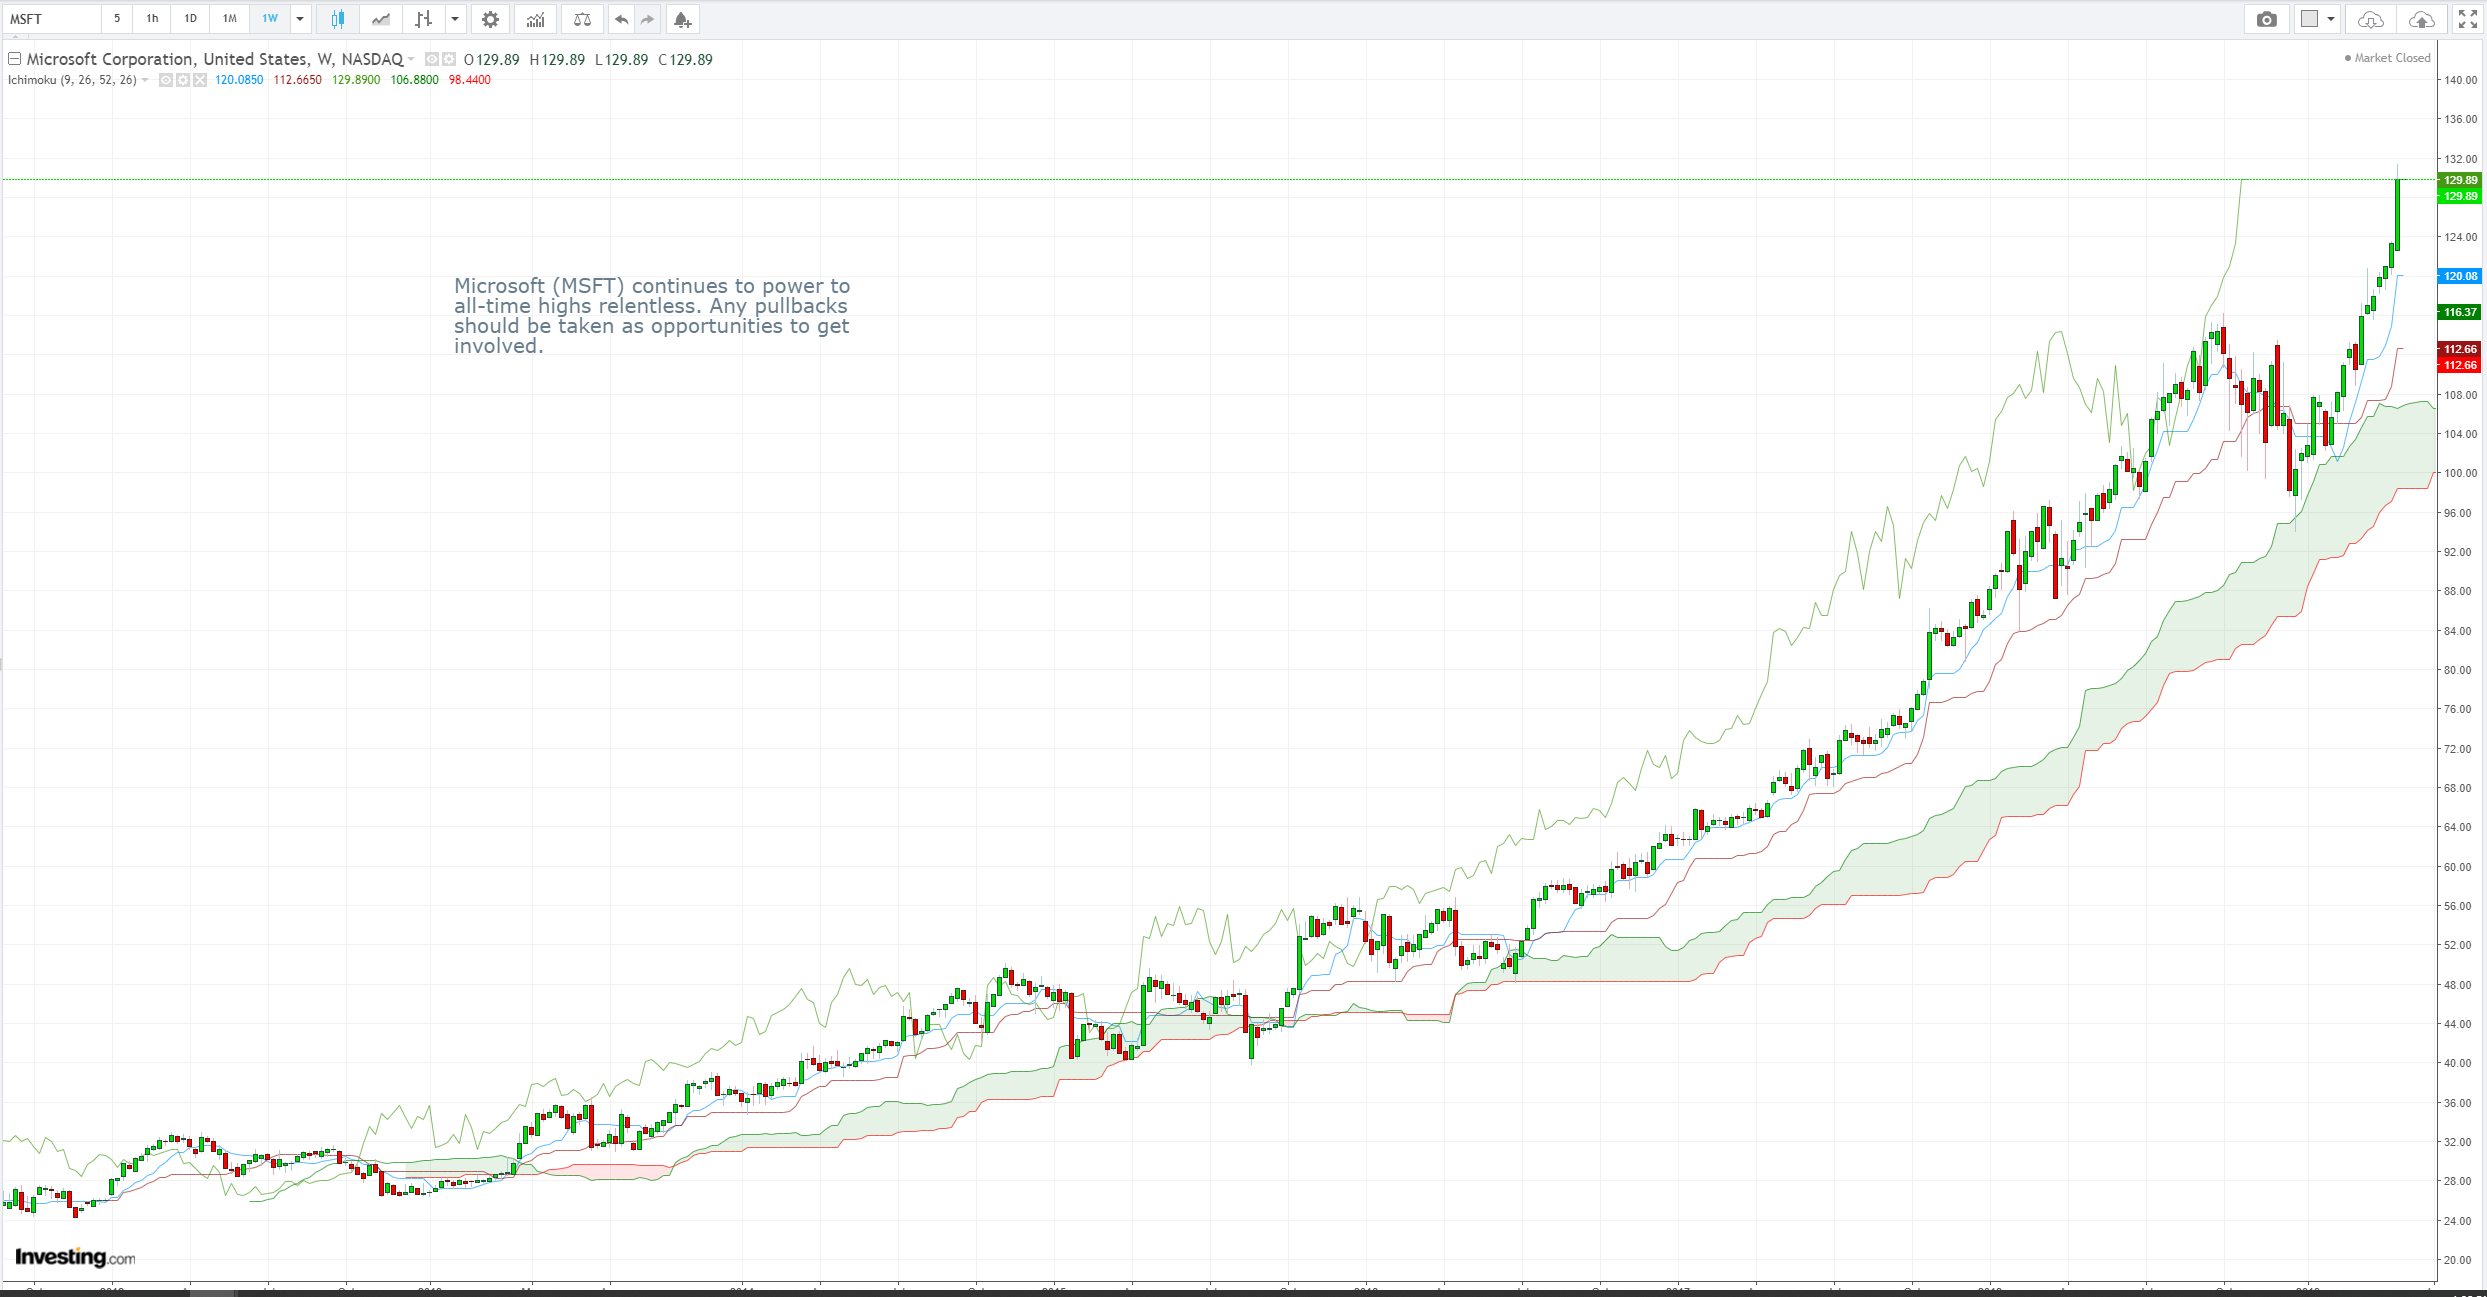
Microsoft (MSFT) Weekly Candlesticks & Ichimoku Chart  – LONG

Microsoft (MSFT) continues to power to all-time highs relentless. Any pullbacks should be taken as opportunities to get involved.

Vee, our Founder/CIO highlights patterns/formations on selected chart(s) every week which may have the potential to turn into trading opportunities. These charts are first sent out on Monday of the week to members subscribed to THE LONG & SHORT OF IT, which helps you to filter out the noise and condense only what’s important in the markets for the week ahead.

Disclaimer: The views and opinions expressed in this material do not constitute a recommendation by TrackRecord Pte. Ltd. that any particular investment, security, transaction or investment strategy is suitable for any specific person. No part of this material may be reproduced or transmitted in any form or by any means, electronic, mechanical, photocopying, recording, or otherwise, without prior written permission of TrackRecord Pte. Ltd

Trade Opportunity: Attempt to break above the daily Ichimoku cloud have failed

EURCAD Daily Candlesticks & Ichimoku Chart    –  SHORT

EUR/CAD: The attempt to break above the daily Ichimoku cloud seems to have failed. Lower levels should be tested in the days to come.


Vee, our Founder/CIO highlights patterns/formations on selected chart(s) every week which may have the potential to turn into trading opportunities. These charts are first sent out on Monday of the week to members subscribed to THE LONG & SHORT OF IT, which helps you to filter out the noise and condense only what’s important in the markets for the week ahead.

Disclaimer: The views and opinions expressed in this material do not constitute a recommendation by TrackRecord Pte. Ltd. that any particular investment, security, transaction or investment strategy is suitable for any specific person. No part of this material may be reproduced or transmitted in any form or by any means, electronic, mechanical, photocopying, recording, or otherwise, without prior written permission of TrackRecord Pte. Ltd
Trade Opportunity: The stock jumped 4.2%, the biggest one day move since Nov 2016

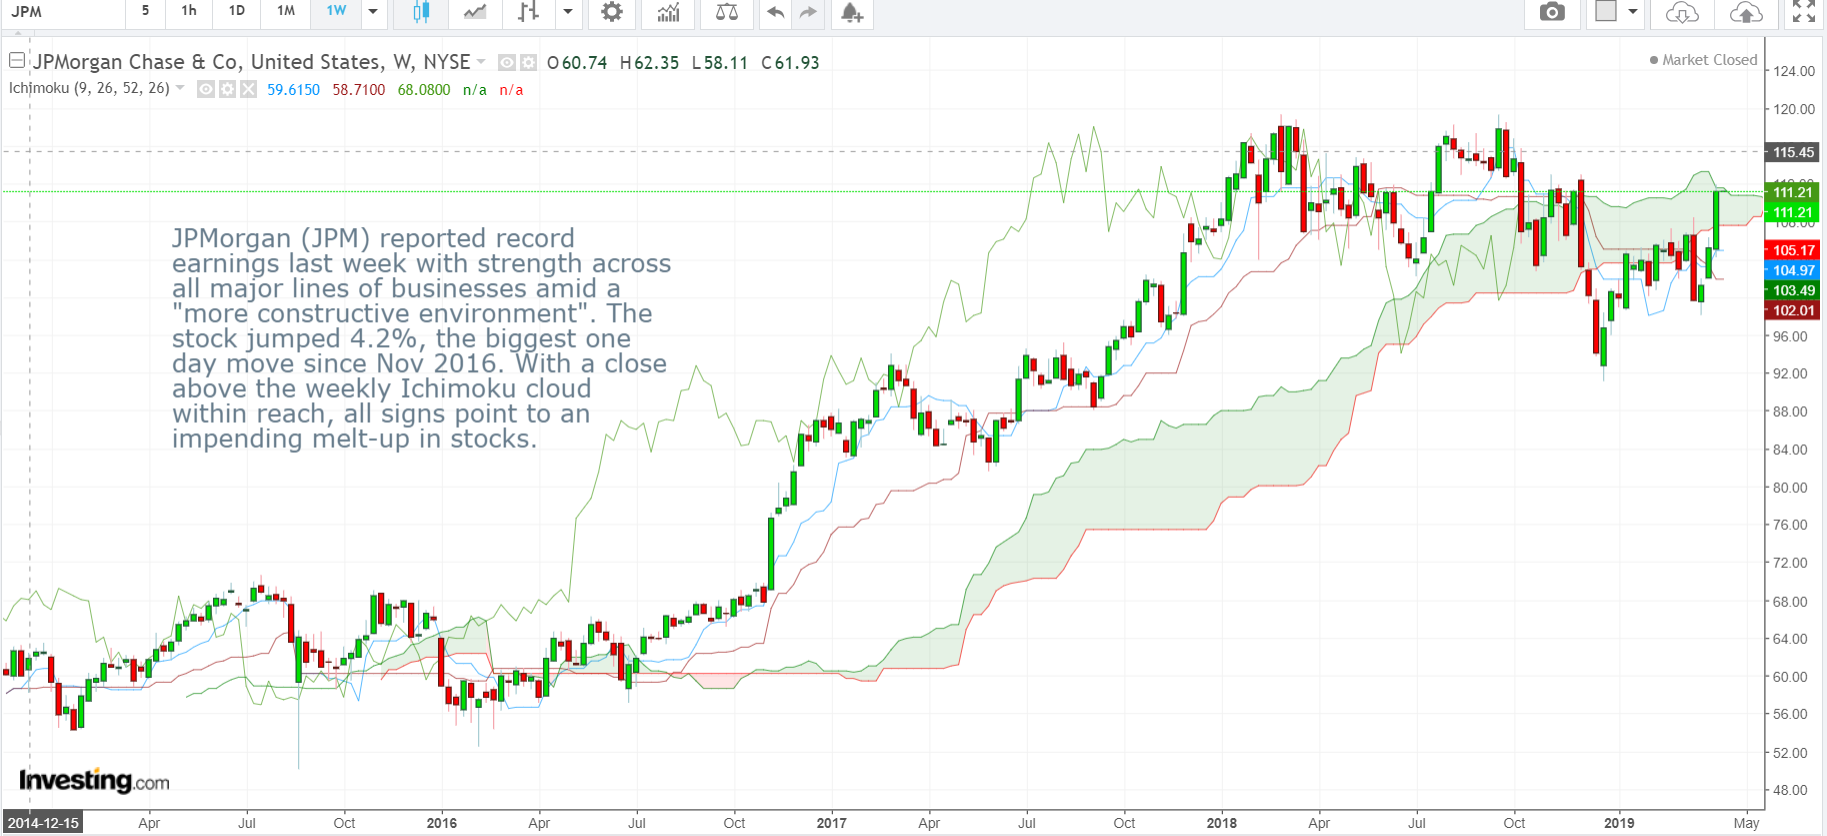
JPMorgan (JPM) weekly Candlesticks & Ichimoku Chart  – LONG

JPMorgan (JPM) reported record earnings last week with strength across all major lines of businesses amid a “more constructive environment”. The stock jumped 4.2%, the biggest one day move since Nov 2016. With a close above the weekly Ichimoku cloud within reach, all signs point to an impending melt-up in stocks.

Vee, our Founder/CIO highlights patterns/formations on selected chart(s) every week which may have the potential to turn into trading opportunities. These charts are first sent out on Monday of the week to members subscribed to THE LONG & SHORT OF IT, which helps you to filter out the noise and condense only what’s important in the markets for the week ahead.

Disclaimer: The views and opinions expressed in this material do not constitute a recommendation by TrackRecord Pte. Ltd. that any particular investment, security, transaction or investment strategy is suitable for any specific person. No part of this material may be reproduced or transmitted in any form or by any means, electronic, mechanical, photocopying, recording, or otherwise, without prior written permission of TrackRecord Pte. Ltd
We are launching tomorrow!

INCUBATION PROGRAMME

Are you up for it?

Trade Opportunities: Despite market pricing expectations of rate cuts by the Federal Reserve, Gold is weakening against the USD

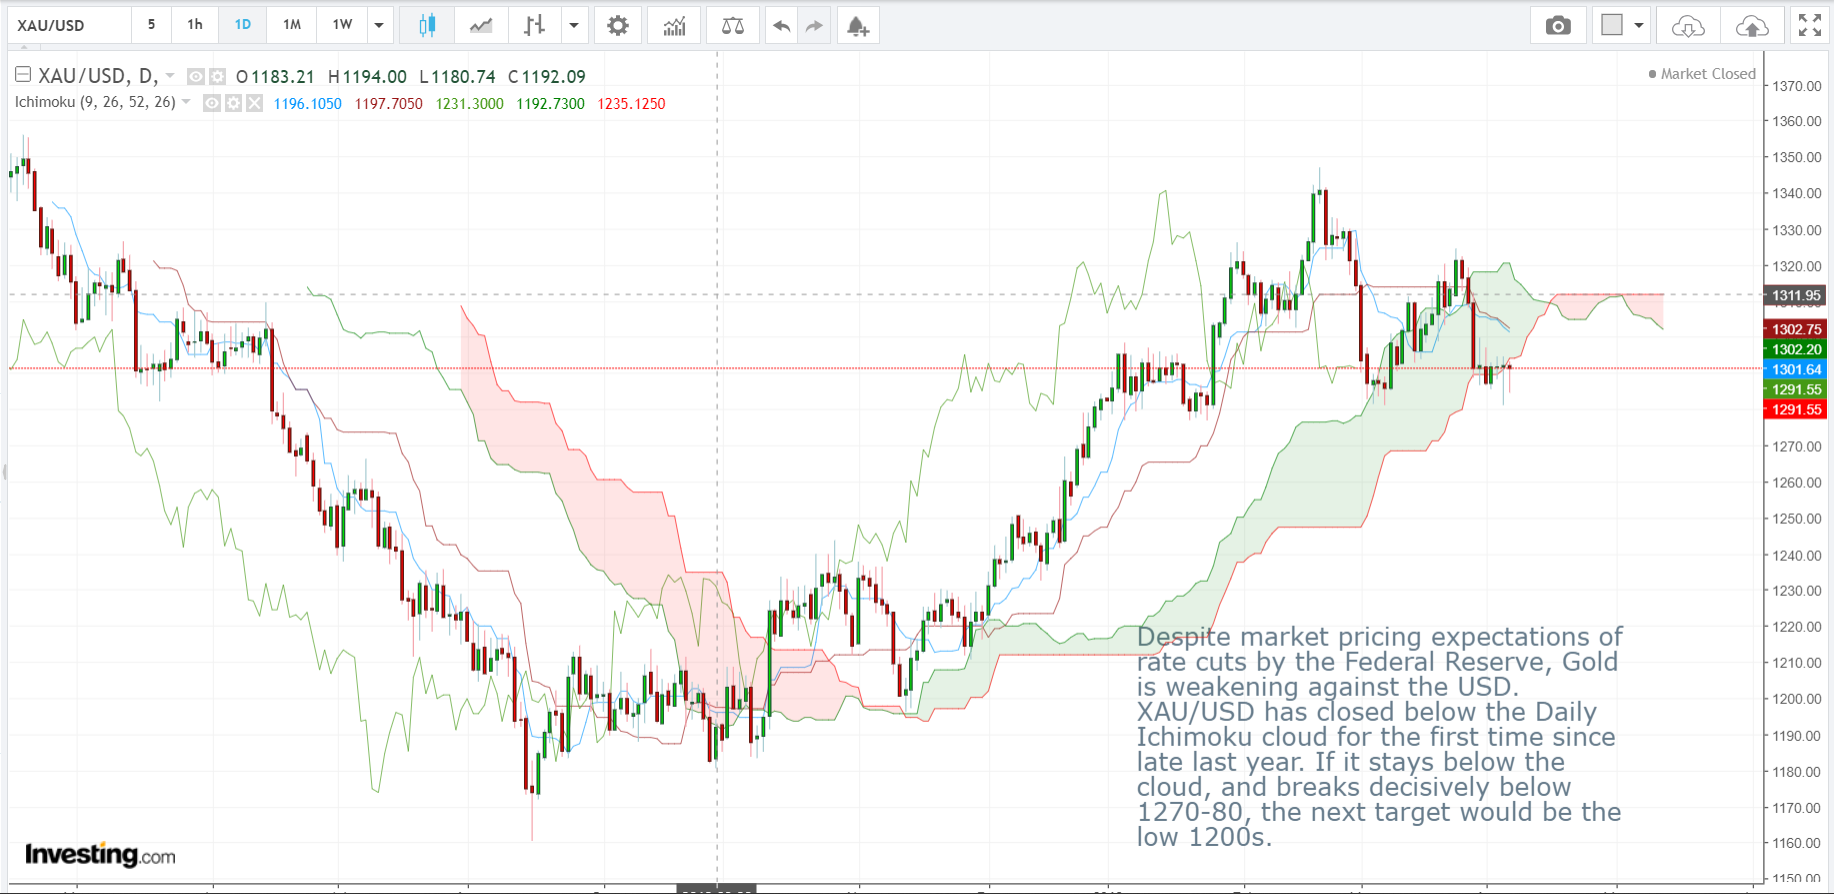
XAU/USD Daily Candlesticks & Ichimoku Chart

Despite market pricing expectations of rate cuts by the Federal Reserve, Gold is weakening against the USD. XAU/USD has closed below the Daily Ichimoku Cloud for the first time since late last year. If it stays below the cloud, and breaks decisively below 1270-80, the next target would be the low 1200s.

Vee, our Founder/CIO highlights patterns/formations on selected chart(s) every week which may have the potential to turn into trading opportunities. These charts are first sent out on Monday of the week to members subscribed to THE LONG & SHORT OF IT, which helps you to filter out the noise and condense only what’s important in the markets for the week ahead.

Disclaimer: The views and opinions expressed in this material do not constitute a recommendation by TrackRecord Pte. Ltd. that any particular investment, security, transaction or investment strategy is suitable for any specific person. No part of this material may be reproduced or transmitted in any form or by any means, electronic, mechanical, photocopying, recording, or otherwise, without prior written permission of TrackRecord Pte. Ltd
We are looking for the next trading talent for our

INCUBATION PROGRAMME

Are you up for it?

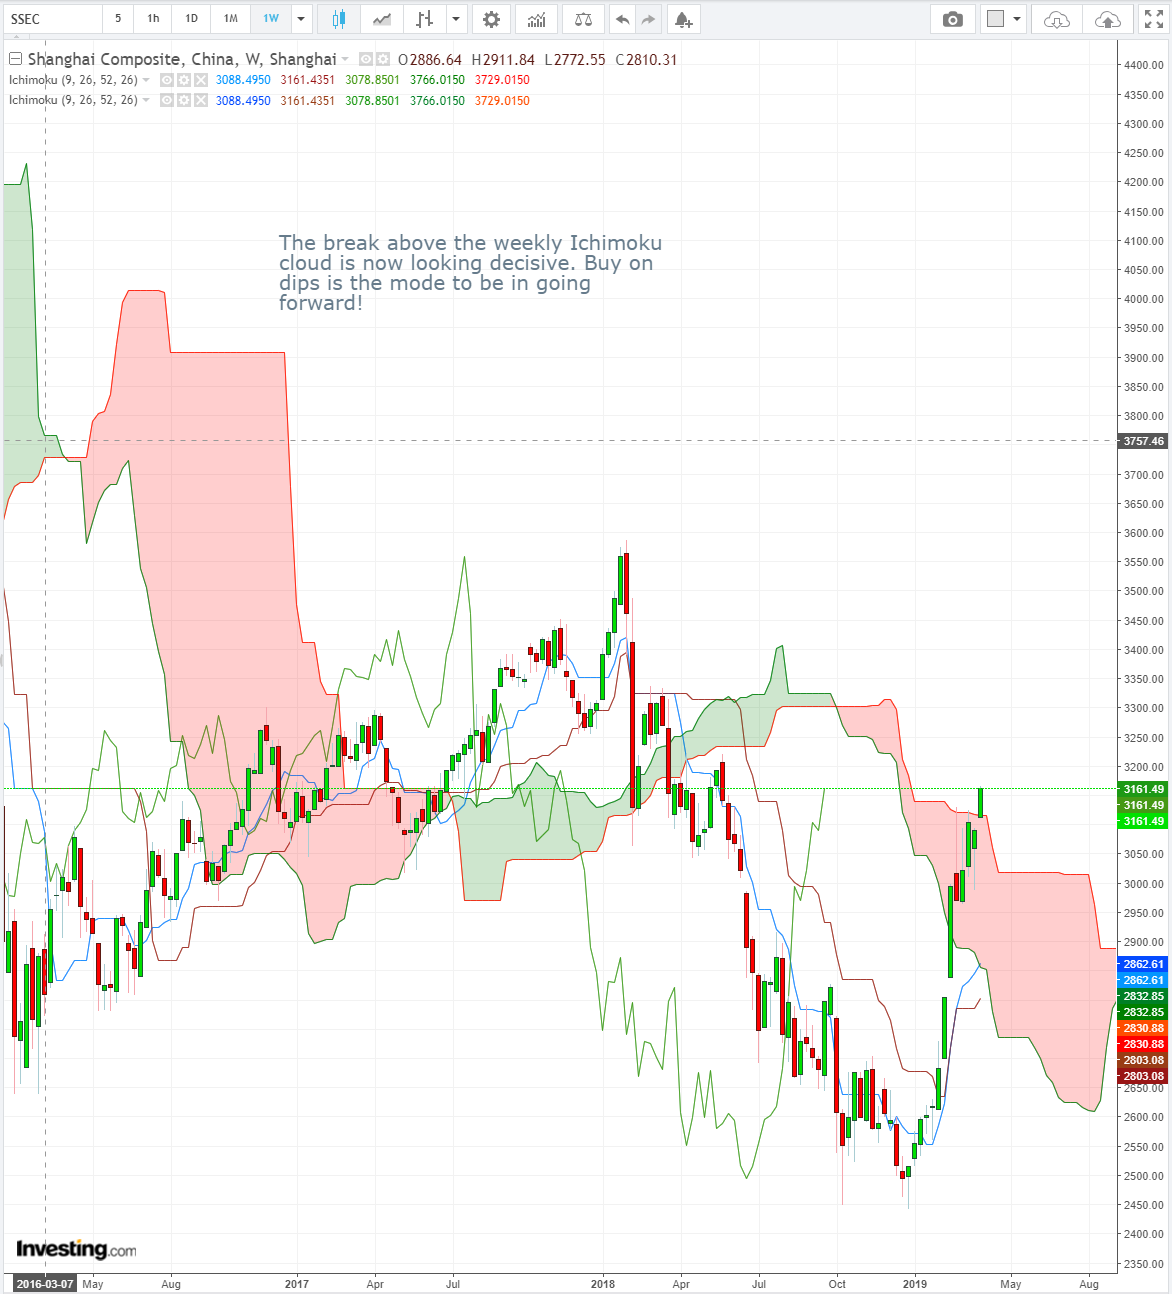
Trade Opportunities: The break above the weekly Ichimoku cloud is now looking decisive

Shanghai Composite Index Weekly Candlesticks & Ichimoku Chart 

The break above the weekly Ichimoku cloud is now looking decisive. Buy on dips is the mode to be in going forward!

Vee, our Founder/CIO highlights patterns/formations on selected chart(s) every week which may have the potential to turn into trading opportunities. These charts are first sent out on Monday of the week to members subscribed to THE LONG & SHORT OF IT, which helps you to filter out the noise and condense only what’s important in the markets for the week ahead.

Disclaimer: The views and opinions expressed in this material do not constitute a recommendation by TrackRecord Pte. Ltd. that any particular investment, security, transaction or investment strategy is suitable for any specific person. No part of this material may be reproduced or transmitted in any form or by any means, electronic, mechanical, photocopying, recording, or otherwise, without prior written permission of TrackRecord Pte. Ltd
We are looking for the next trading talent to trade up to

A MILLION DOLLARS!

Are you up for it?

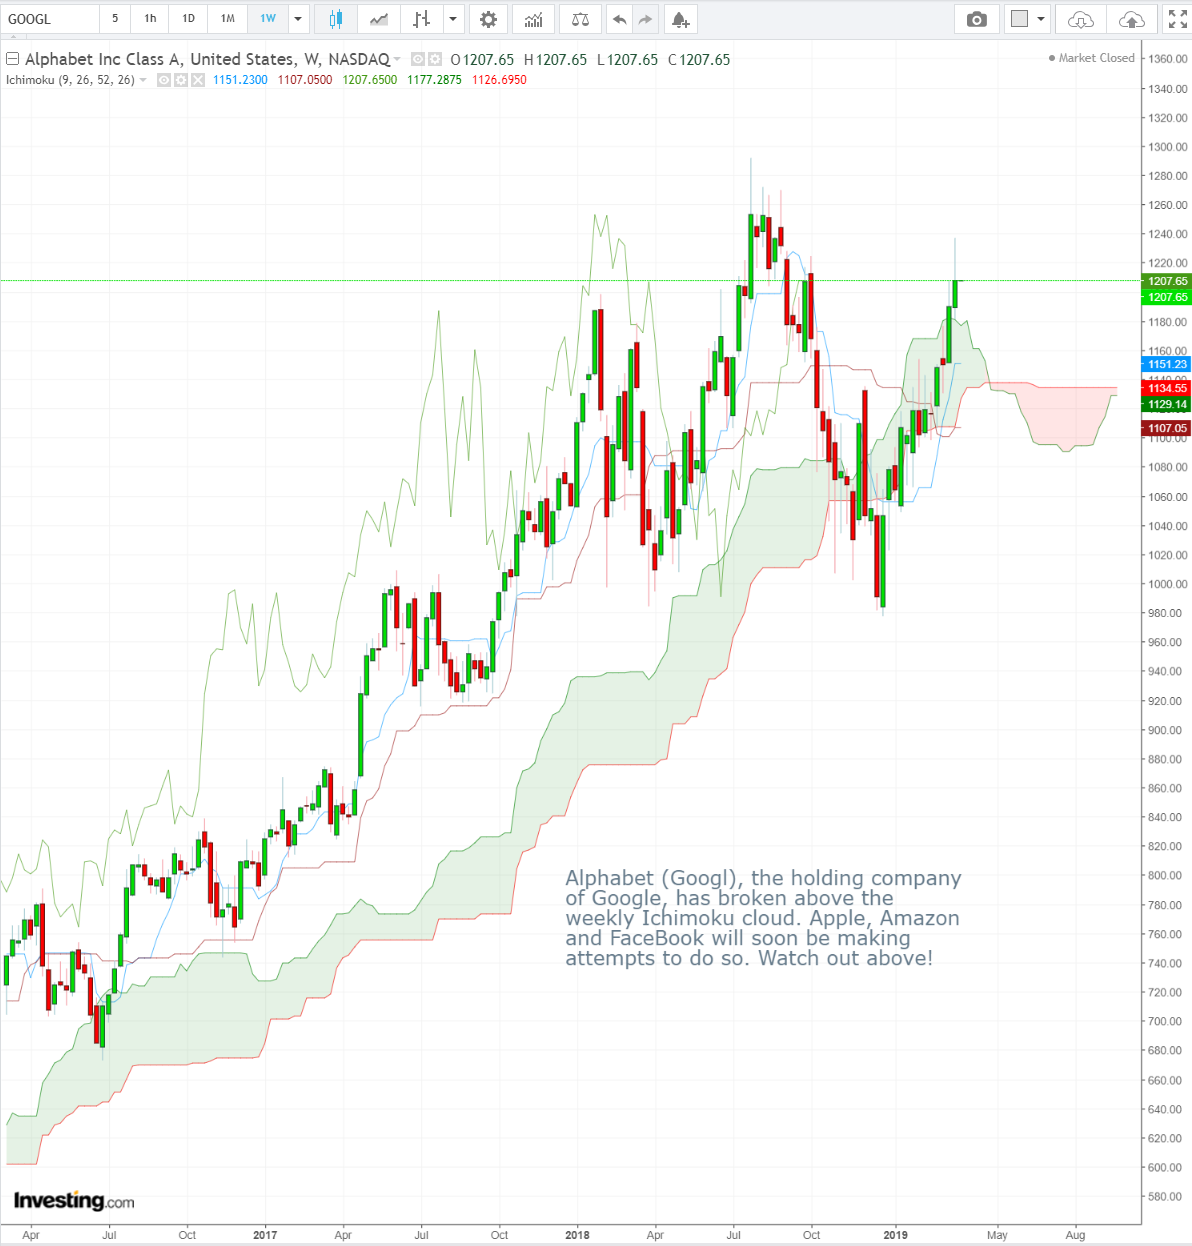
Trade Opportunities: Apple, Amazon and Facebook will soon be making attempts to do so

Alphabet (GOOGL) Weekly Candlesticks & Ichimoku Chart

Alphabet (GOOGL), the holding company of Google, has broken above the weekly Ichimoku cloud. Apple, Amazon and Facebook will soon be making attempts to do so. Watch out above!

Vee, our Founder/CIO highlights patterns/formations on selected chart(s) every week which may have the potential to turn into trading opportunities. These charts are first sent out on Monday of the week to members subscribed to THE LONG & SHORT OF IT, which helps you to filter out the noise and condense only what’s important in the markets for the week ahead.

Disclaimer: The views and opinions expressed in this material do not constitute a recommendation by TrackRecord Pte. Ltd. that any particular investment, security, transaction or investment strategy is suitable for any specific person. No part of this material may be reproduced or transmitted in any form or by any means, electronic, mechanical, photocopying, recording, or otherwise, without prior written permission of TrackRecord Pte. Ltd
We are looking for the next trading talent to trade

A MILLION DOLLARS!

Are you up for it?

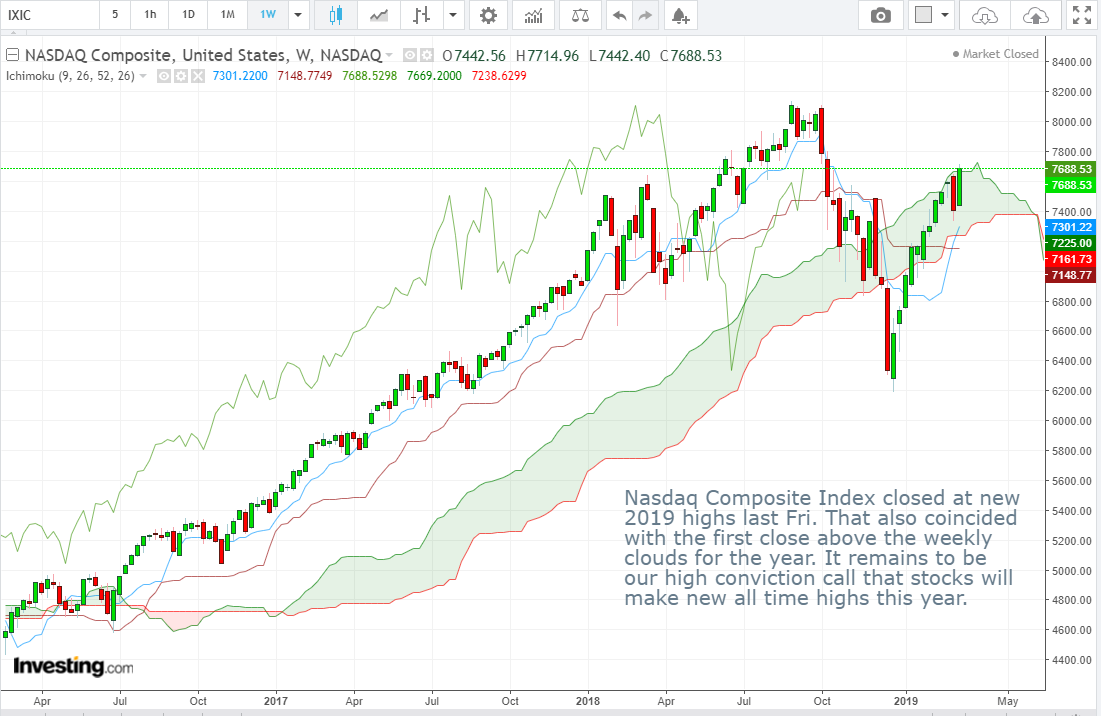
Trade Opportunity: Nasdaq Composite Index closed at new 2019 highs last Fri

NASDAQ Composite Index (IXIC) Weekly Candlesticks & Ichimoku ChartLONG

Nasdaq Composite Index closed at new 2019 highs last Fri. That also coincided with the first close above the weekly clouds for the year. It remains to be our high conviction call that stocks will make new all time highs this year.

Vee, our Founder/CIO highlights patterns/formations on selected chart(s) every week which may have the potential to turn into trading opportunities. These charts are first sent out on Monday of the week to members subscribed to THE LONG & SHORT OF IT, which helps you to filter out the noise and condense only what’s important in the markets for the week ahead.

Disclaimer: The views and opinions expressed in this material do not constitute a recommendation by TrackRecord Pte. Ltd. that any particular investment, security, transaction or investment strategy is suitable for any specific person. No part of this material may be reproduced or transmitted in any form or by any means, electronic, mechanical, photocopying, recording, or otherwise, without prior written permission of TrackRecord Pte. Ltd
We are looking for the next trading talent to trade

A MILLION DOLLARS!

Are you up for it?

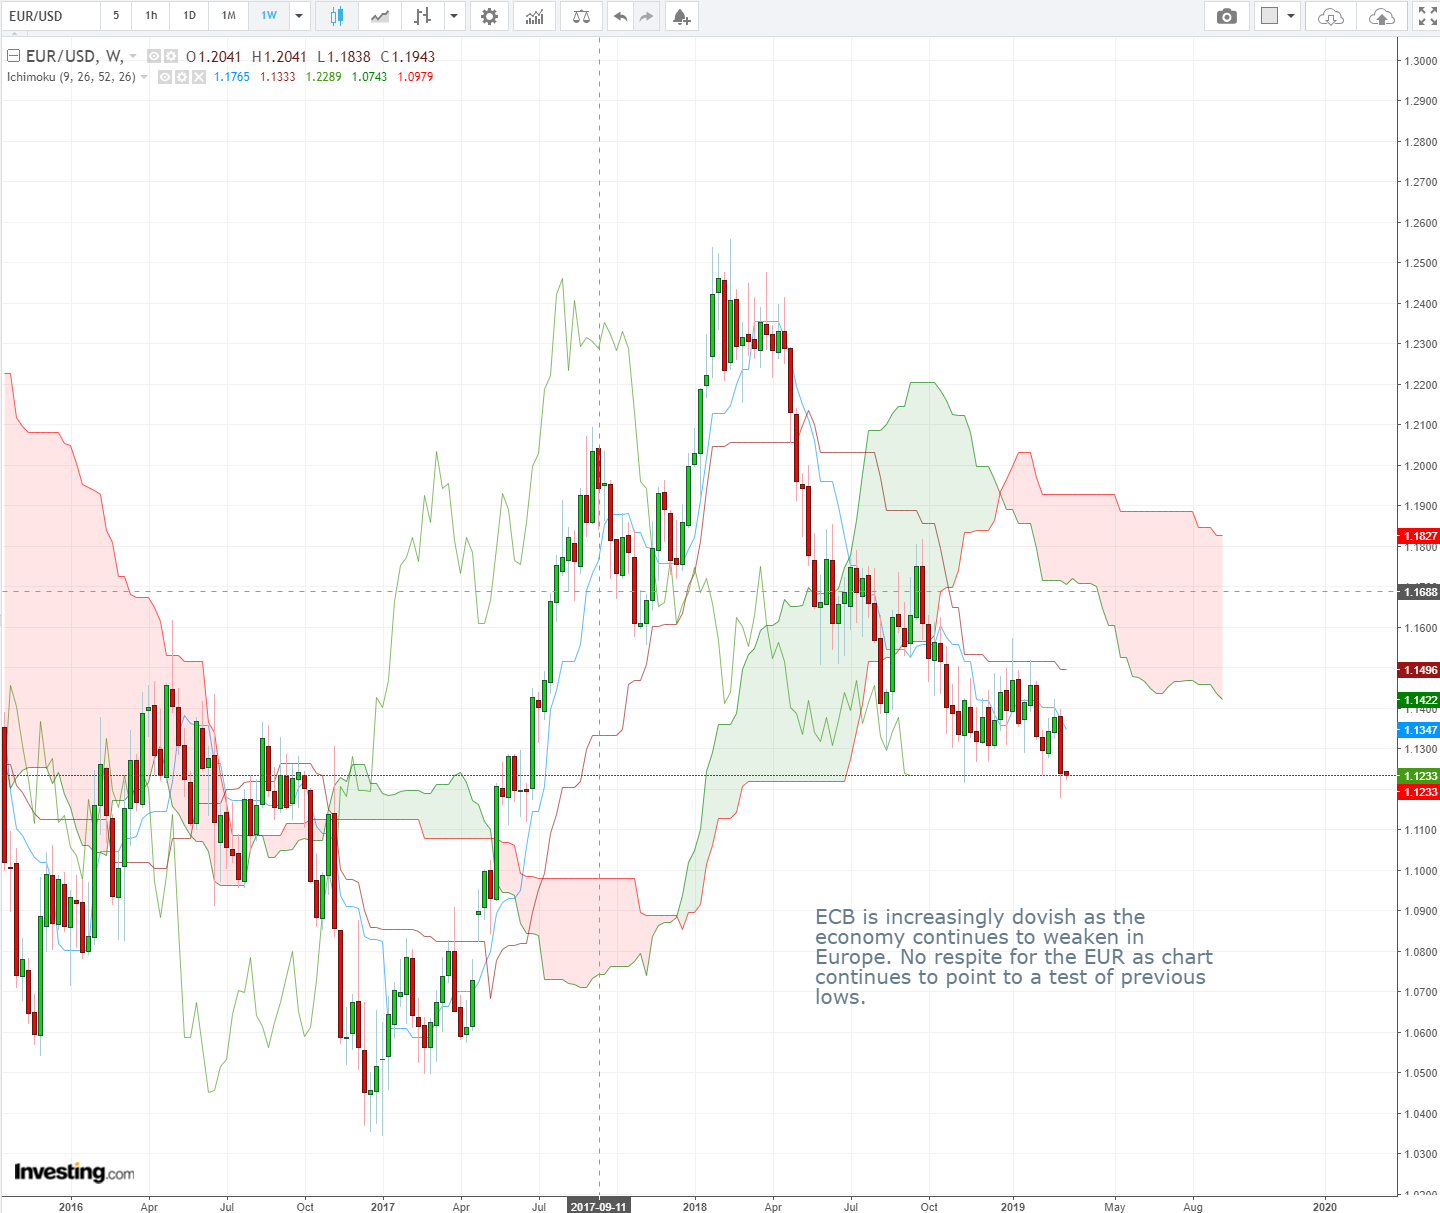
Trade Opportunity: ECB is increasingly dovish as the economy continues to weaken in Europe

EUR/USD Weekly Candlesticks & Ichimoku Chart  – SHORT

ECB is increasingly dovish as the economy continues to weaken in Europe. No respite for the EUR as chart continues to point to a test of previous lows.

Vee, our Founder/CIO highlights patterns/formations on selected chart(s) every week which may have the potential to turn into trading opportunities. These charts are first sent out on Monday of the week to members subscribed to THE LONG & SHORT OF IT, which helps you to filter out the noise and condense only what’s important in the markets for the week ahead.

Disclaimer: The views and opinions expressed in this material do not constitute a recommendation by TrackRecord Pte. Ltd. that any particular investment, security, transaction or investment strategy is suitable for any specific person. No part of this material may be reproduced or transmitted in any form or by any means, electronic, mechanical, photocopying, recording, or otherwise, without prior written permission of TrackRecord Pte. Ltd
We are looking for the next trading talent to trade

A MILLION DOLLARS!

Are you up for it?

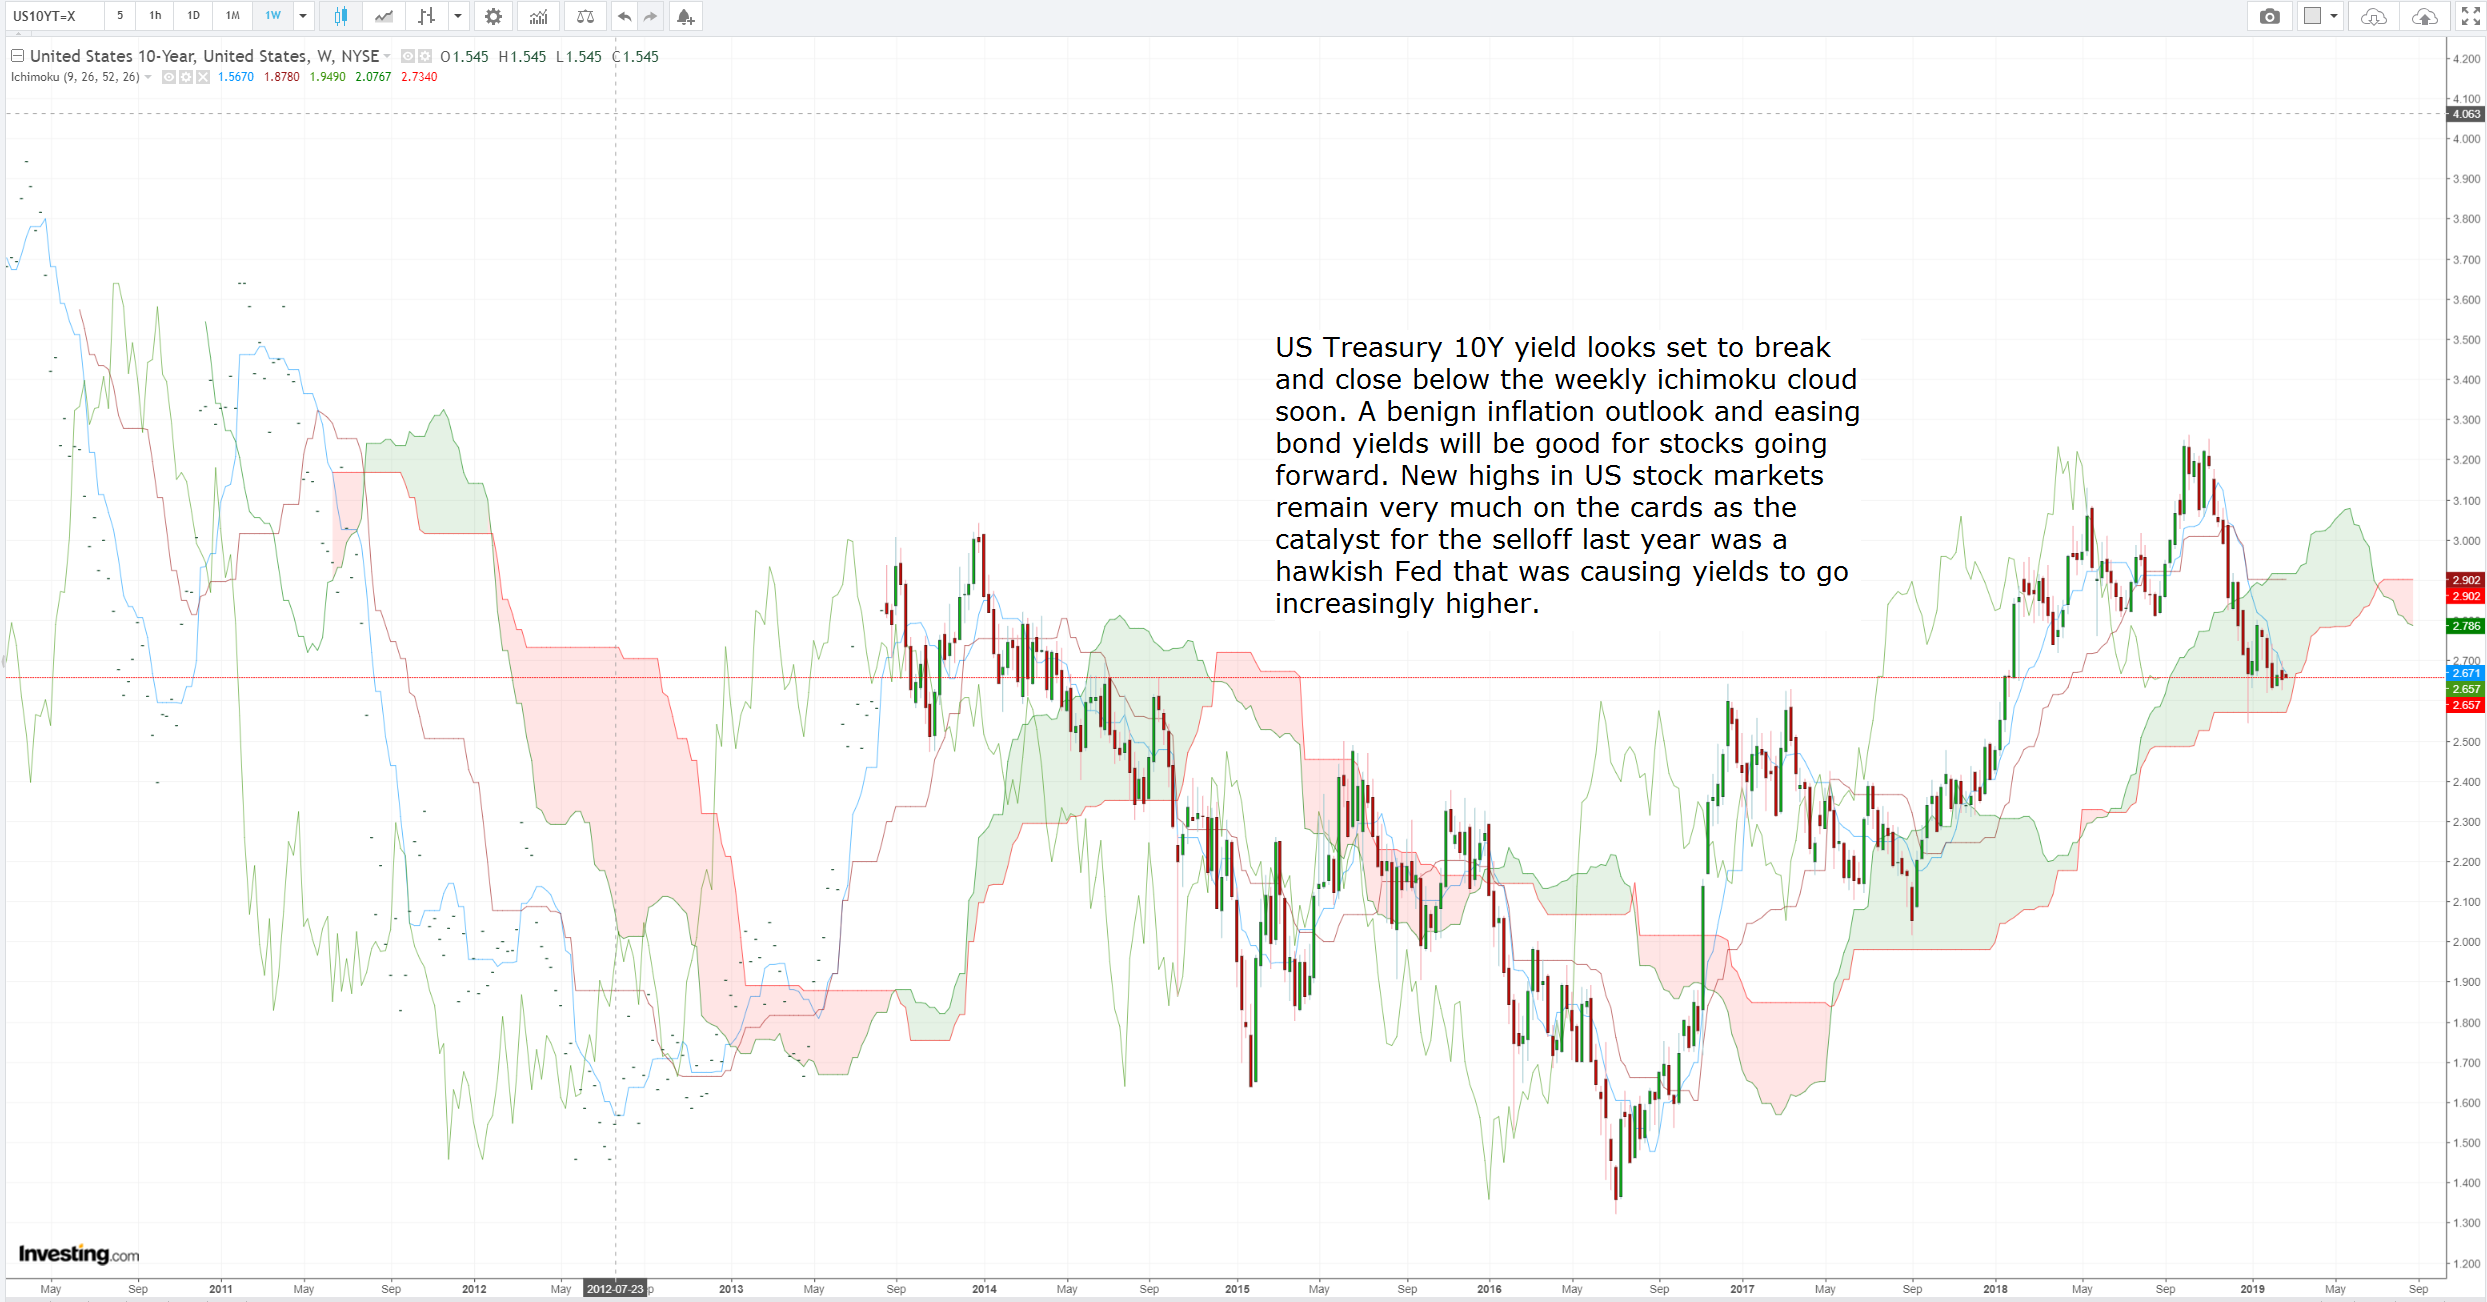
Trade Opportunity: US Treasury 10Y yield looks set to break and close below the weekly ichimoku cloud soon

US Treasury 10Y Yield Weekly Candlesticks & Ichimoku Chart

US Treasury 10Y yield looks set to break and close below the weekly ichimoku cloud soon. A benign inflation outlook and easing bond yields will be good for stocks going forward. New highs in US stock markets remain very much on the cards as the catalyst for the selloff last year was a hawkish Fed that was causing yields to go increasingly higher.


Vee, our Founder/CIO highlights patterns/formations on selected chart(s) every week which may have the potential to turn into trading opportunities. These charts are first sent out on Monday of the week to members subscribed to THE LONG & SHORT OF IT, which helps you to filter out the noise and condense only what’s important in the markets for the week ahead.

Disclaimer: The views and opinions expressed in this material do not constitute a recommendation by TrackRecord Pte. Ltd. that any particular investment, security, transaction or investment strategy is suitable for any specific person. No part of this material may be reproduced or transmitted in any form or by any means, electronic, mechanical, photocopying, recording, or otherwise, without prior written permission of TrackRecord Pte. Ltd

Want to keep in touch with daily market movers through a quick 2 min read? Click here to do so!