
JPMorgan (JPM) weekly Candlesticks & Ichimoku Chart – LONG
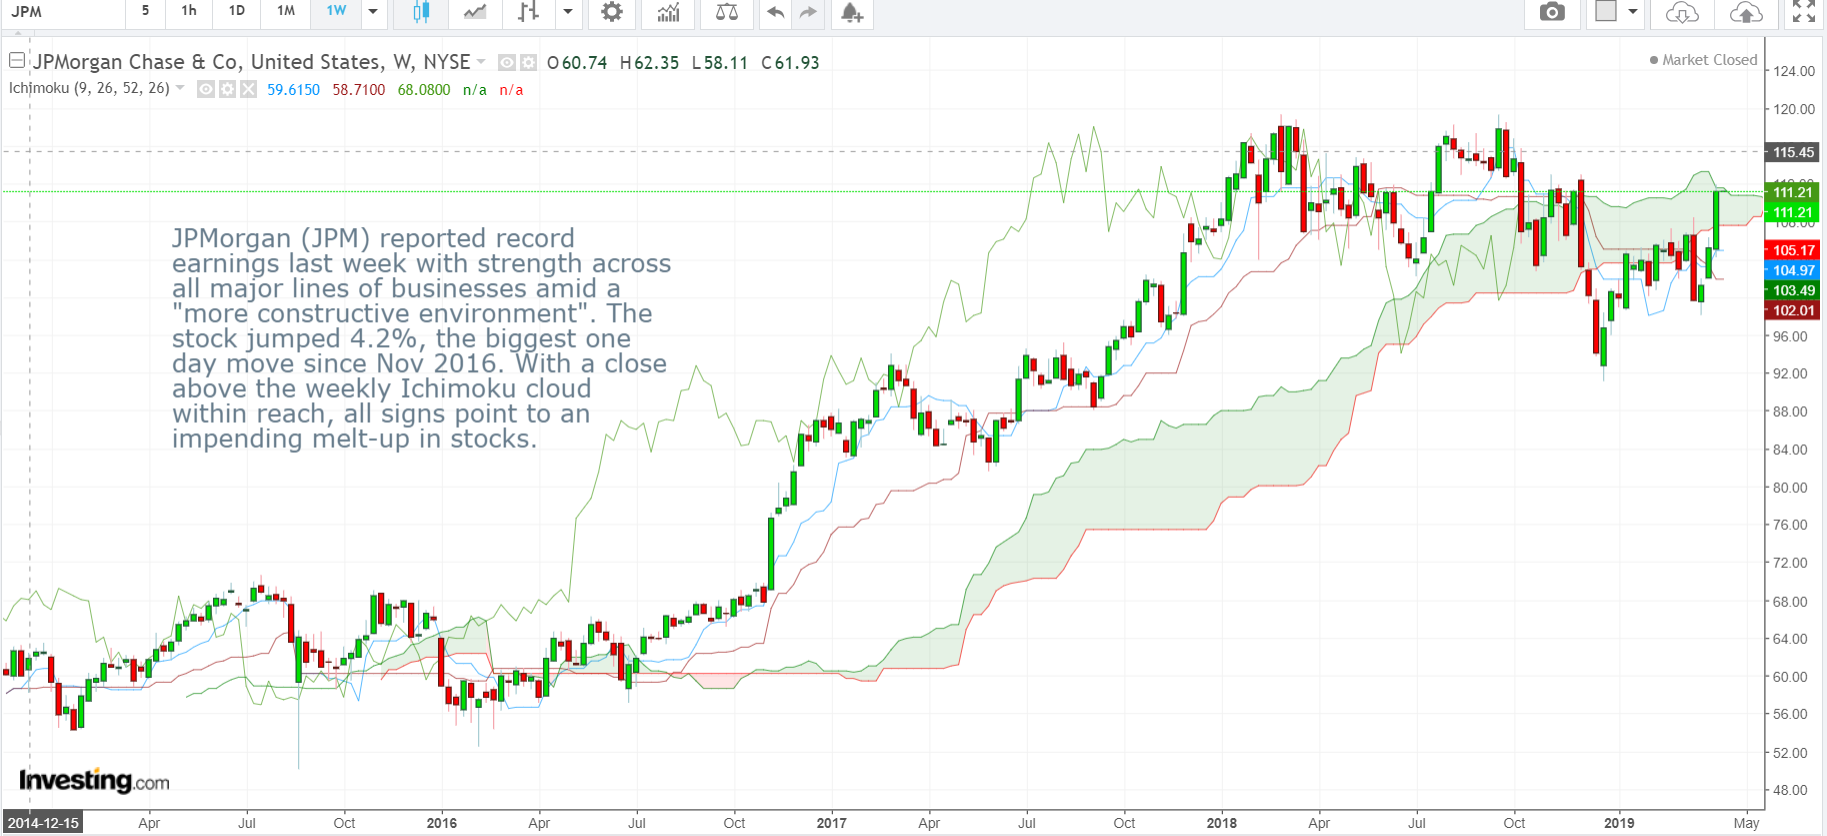
JPMorgan (JPM) reported record earnings last week with strength across all major lines of businesses amid a “more constructive environment”. The stock jumped 4.2%, the biggest one day move since Nov 2016. With a close above the weekly Ichimoku cloud within reach, all signs point to an impending melt-up in stocks.
Vee, our Founder/CIO highlights patterns/formations on selected chart(s) every week which may have the potential to turn into trading opportunities. These charts are first sent out on Monday of the week to members subscribed to THE LONG & SHORT OF IT, which helps you to filter out the noise and condense only what’s important in the markets for the week ahead.
Disclaimer: The views and opinions expressed in this material do not constitute a recommendation by TrackRecord Pte. Ltd. that any particular investment, security, transaction or investment strategy is suitable for any specific person. No part of this material may be reproduced or transmitted in any form or by any means, electronic, mechanical, photocopying, recording, or otherwise, without prior written permission of TrackRecord Pte. Ltd