AUD/NZD Daily Candlesticks & Ichimoku Chart – SHORT
AUD/NZD has now closed decisively below the daily Ichimoku clouds. 1.0650 level should be a strong resistance going forward.

Vee, our Founder/CIO highlights patterns/formations on selected chart(s) every week which may have the potential to turn into trading opportunities. These charts are first sent out on Monday of the week to the TRACKRECORD COMMUNITY which helps them to filter out the noise and condense only what’s important in the markets for the week ahead.
Disclaimer: The views and opinions expressed in this material do not constitute a recommendation by TrackRecord Pte. Ltd. that any particular investment, security, transaction or investment strategy is suitable for any specific person. No part of this material may be reproduced or transmitted in any form or by any means, electronic, mechanical, photocopying, recording, or otherwise, without prior written permission of TrackRecord Pte. Ltd
USD/CAD Daily Candlesticks & Ichimoku Chart – SHORT
Bearish reversal candle and failure of price to close above the Daily Ichimoku cloud give a good opportunity to short USD/CAD

Vee, our Founder/CIO highlights patterns/formations on selected chart(s) every week which may have the potential to turn into trading opportunities. These charts are first sent out on Monday of the week to the TRACKRECORD COMMUNITY which helps them to filter out the noise and condense only what’s important in the markets for the week ahead.
Disclaimer: The views and opinions expressed in this material do not constitute a recommendation by TrackRecord Pte. Ltd. that any particular investment, security, transaction or investment strategy is suitable for any specific person. No part of this material may be reproduced or transmitted in any form or by any means, electronic, mechanical, photocopying, recording, or otherwise, without prior written permission of TrackRecord Pte. Ltd
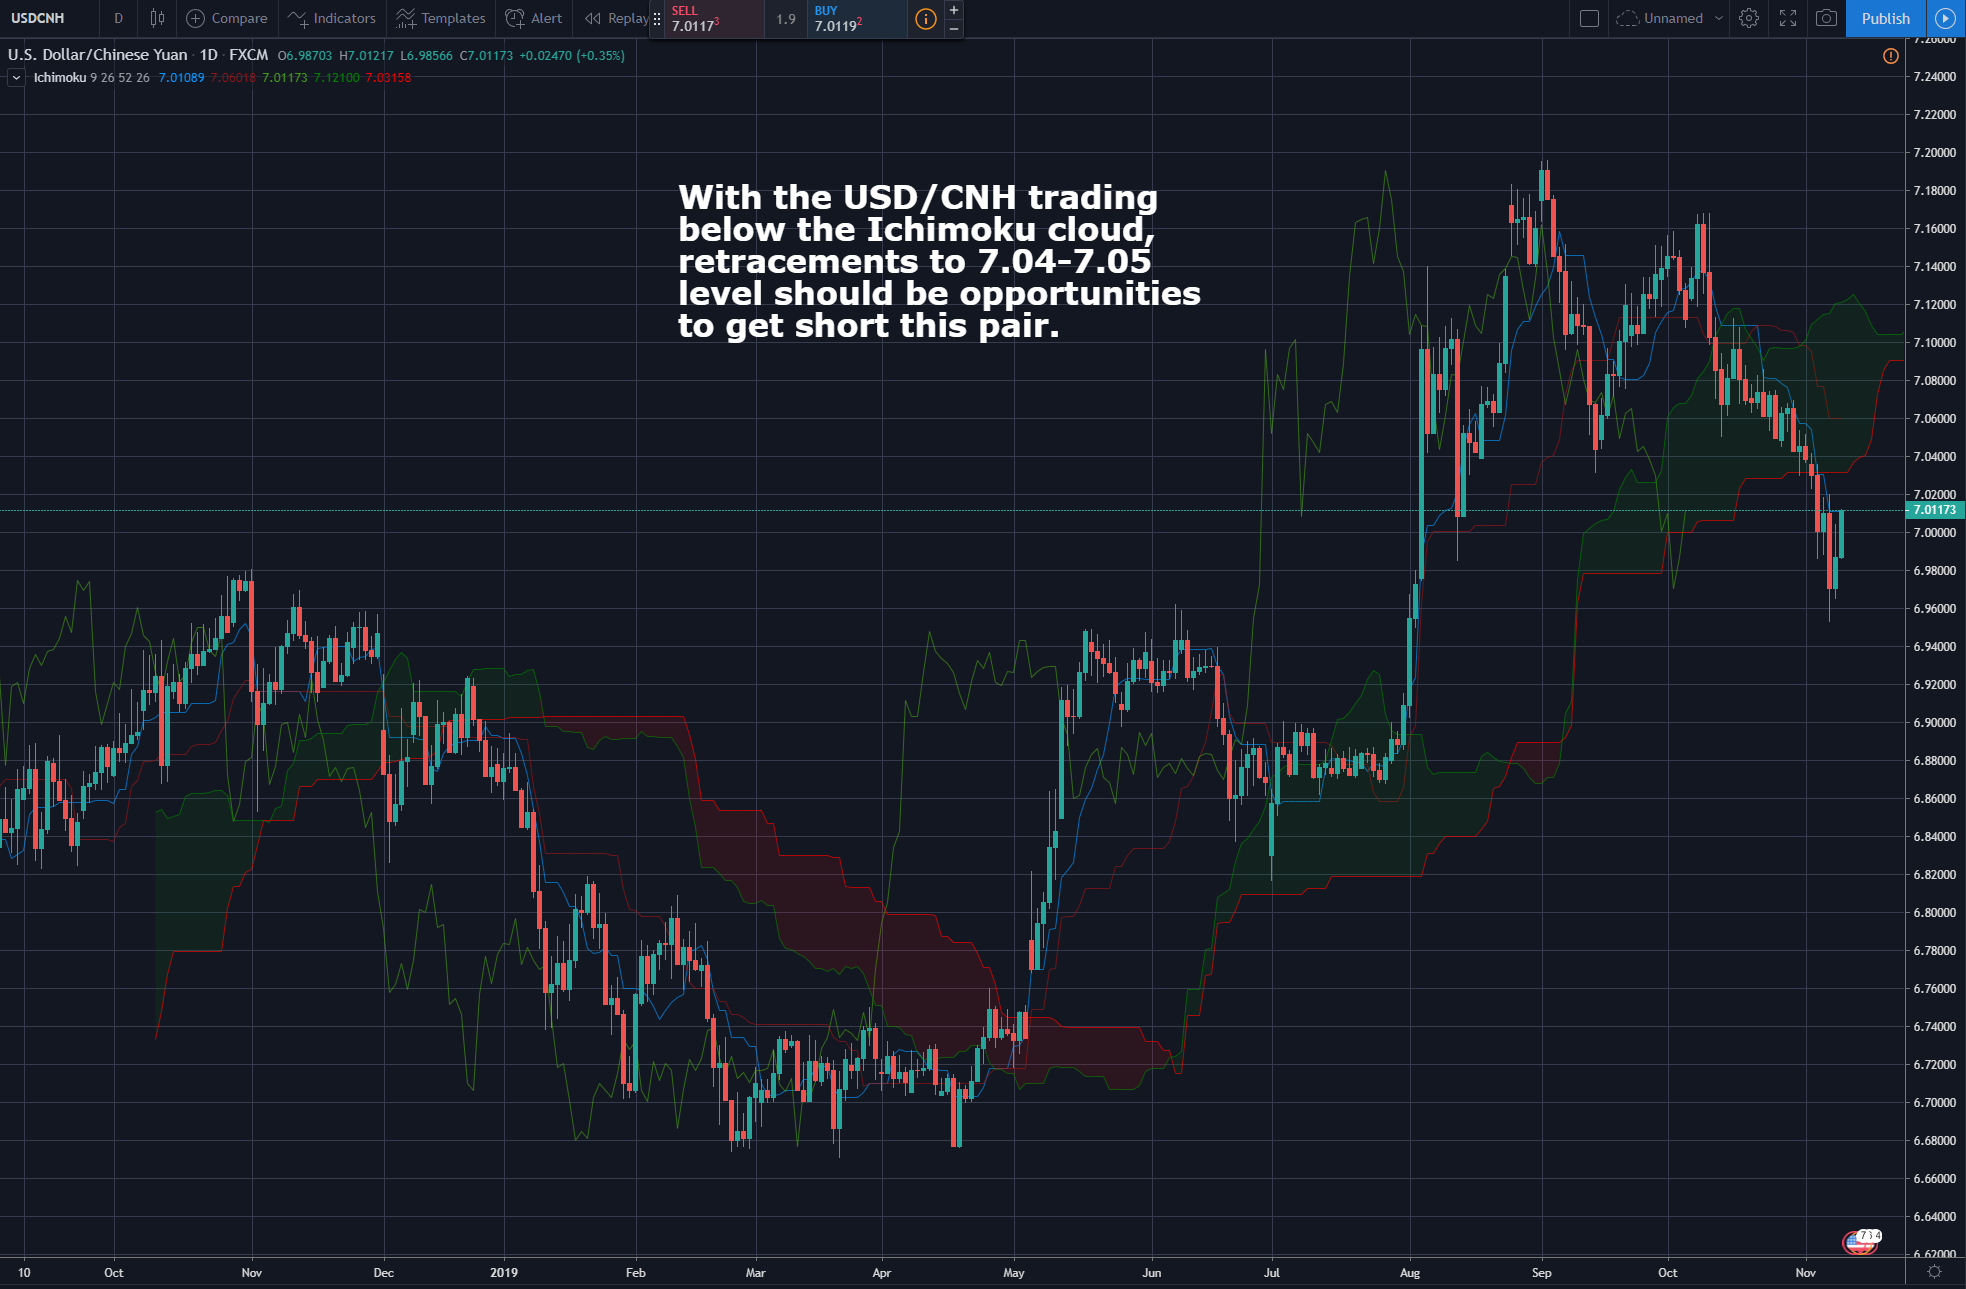
USD/CNH Daily Candlesticks & Ichimoku Chart – SHORT
With the USD/CNH trading below the Ichimoku cloud, retracements to 7.04 – 7.05 level should be opportunities to get short this pair.
Vee, our Founder/CIO highlights patterns/formations on selected chart(s) every week which may have the potential to turn into trading opportunities. These charts are first sent out on Monday of the week to the TRACKRECORD COMMUNITY which helps them to filter out the noise and condense only what’s important in the markets for the week ahead.
Disclaimer: The views and opinions expressed in this material do not constitute a recommendation by TrackRecord Pte. Ltd. that any particular investment, security, transaction or investment strategy is suitable for any specific person. No part of this material may be reproduced or transmitted in any form or by any means, electronic, mechanical, photocopying, recording, or otherwise, without prior written permission of TrackRecord Pte. Ltd
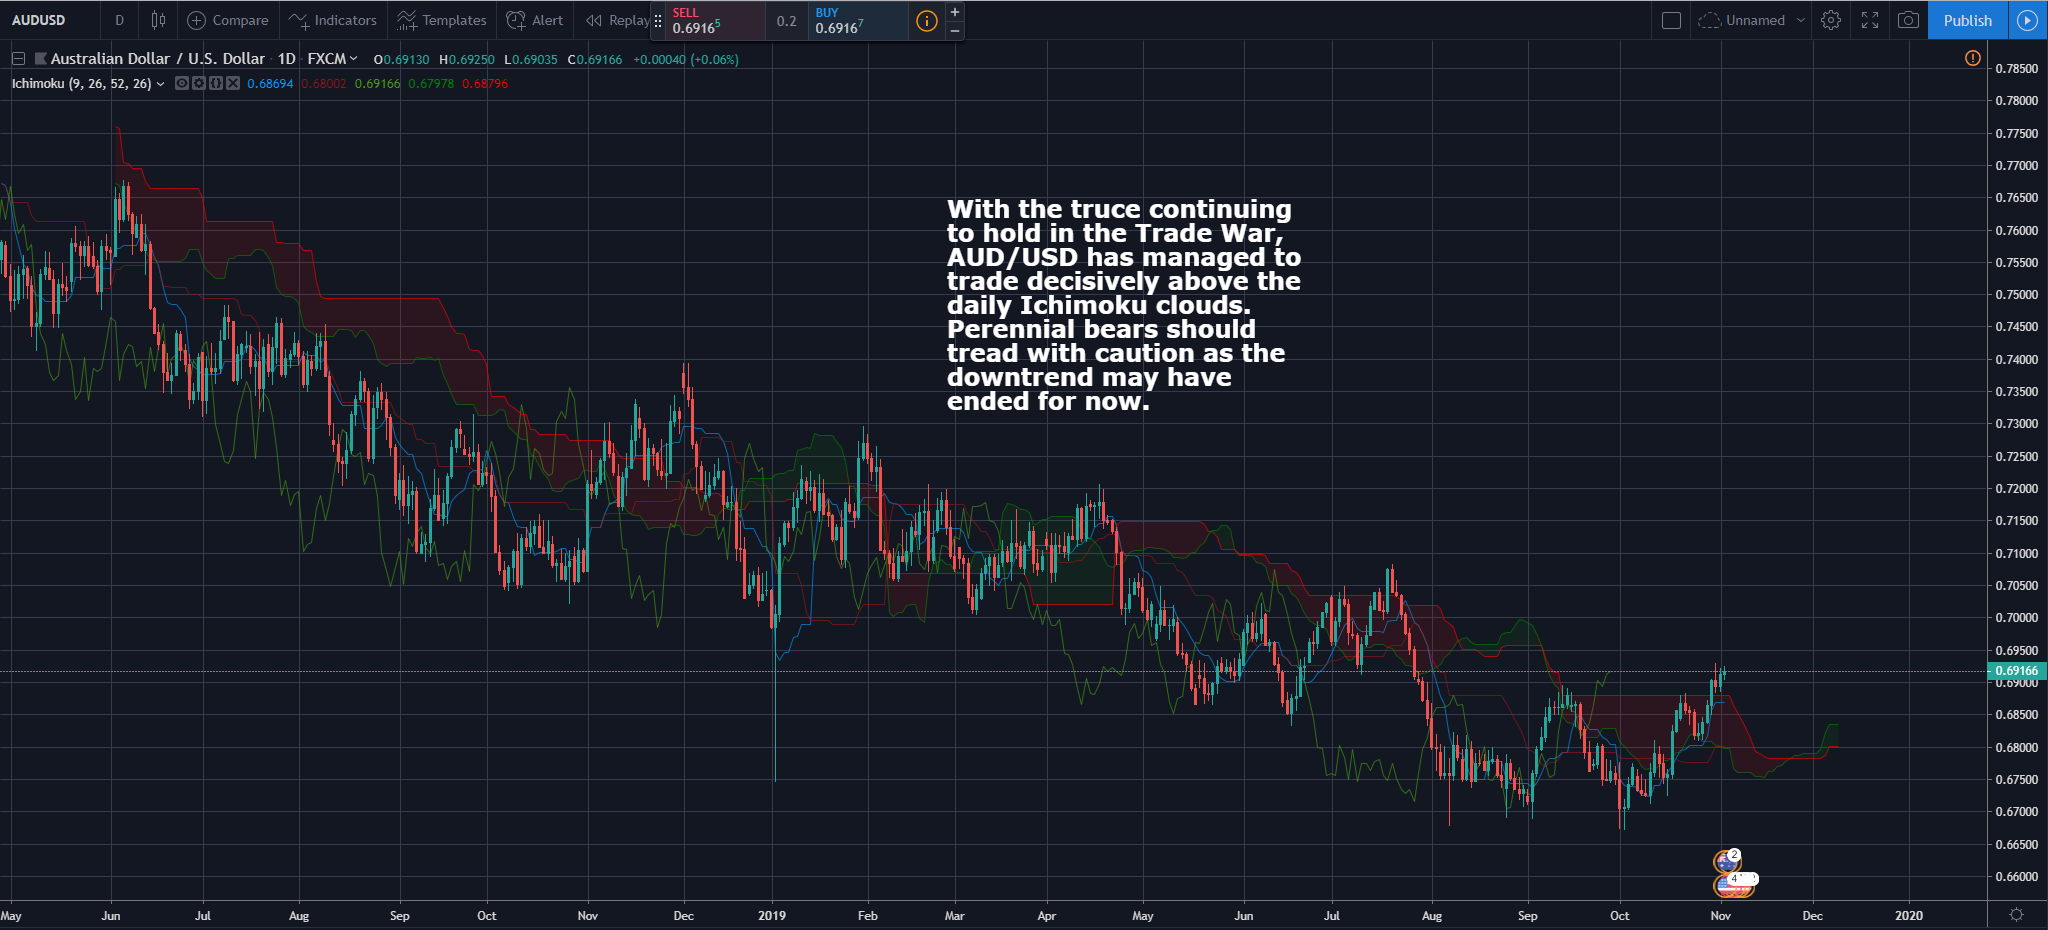
AUD/USD Daily Candlesticks & Ichimoku Chart – LONG
With the truce continuing to hold in the Trade War, AUD/USD has managed to trade decisively above the daily Ichimoku clouds. Perennial bears should tread with caution as the downtrend may have ended for now.
Vee, our Founder/CIO highlights patterns/formations on selected chart(s) every week which may have the potential to turn into trading opportunities. These charts are first sent out on Monday of the week to the TRACKRECORD COMMUNITY which helps them to filter out the noise and condense only what’s important in the markets for the week ahead.
Disclaimer: The views and opinions expressed in this material do not constitute a recommendation by TrackRecord Pte. Ltd. that any particular investment, security, transaction or investment strategy is suitable for any specific person. No part of this material may be reproduced or transmitted in any form or by any means, electronic, mechanical, photocopying, recording, or otherwise, without prior written permission of TrackRecord Pte. Ltd
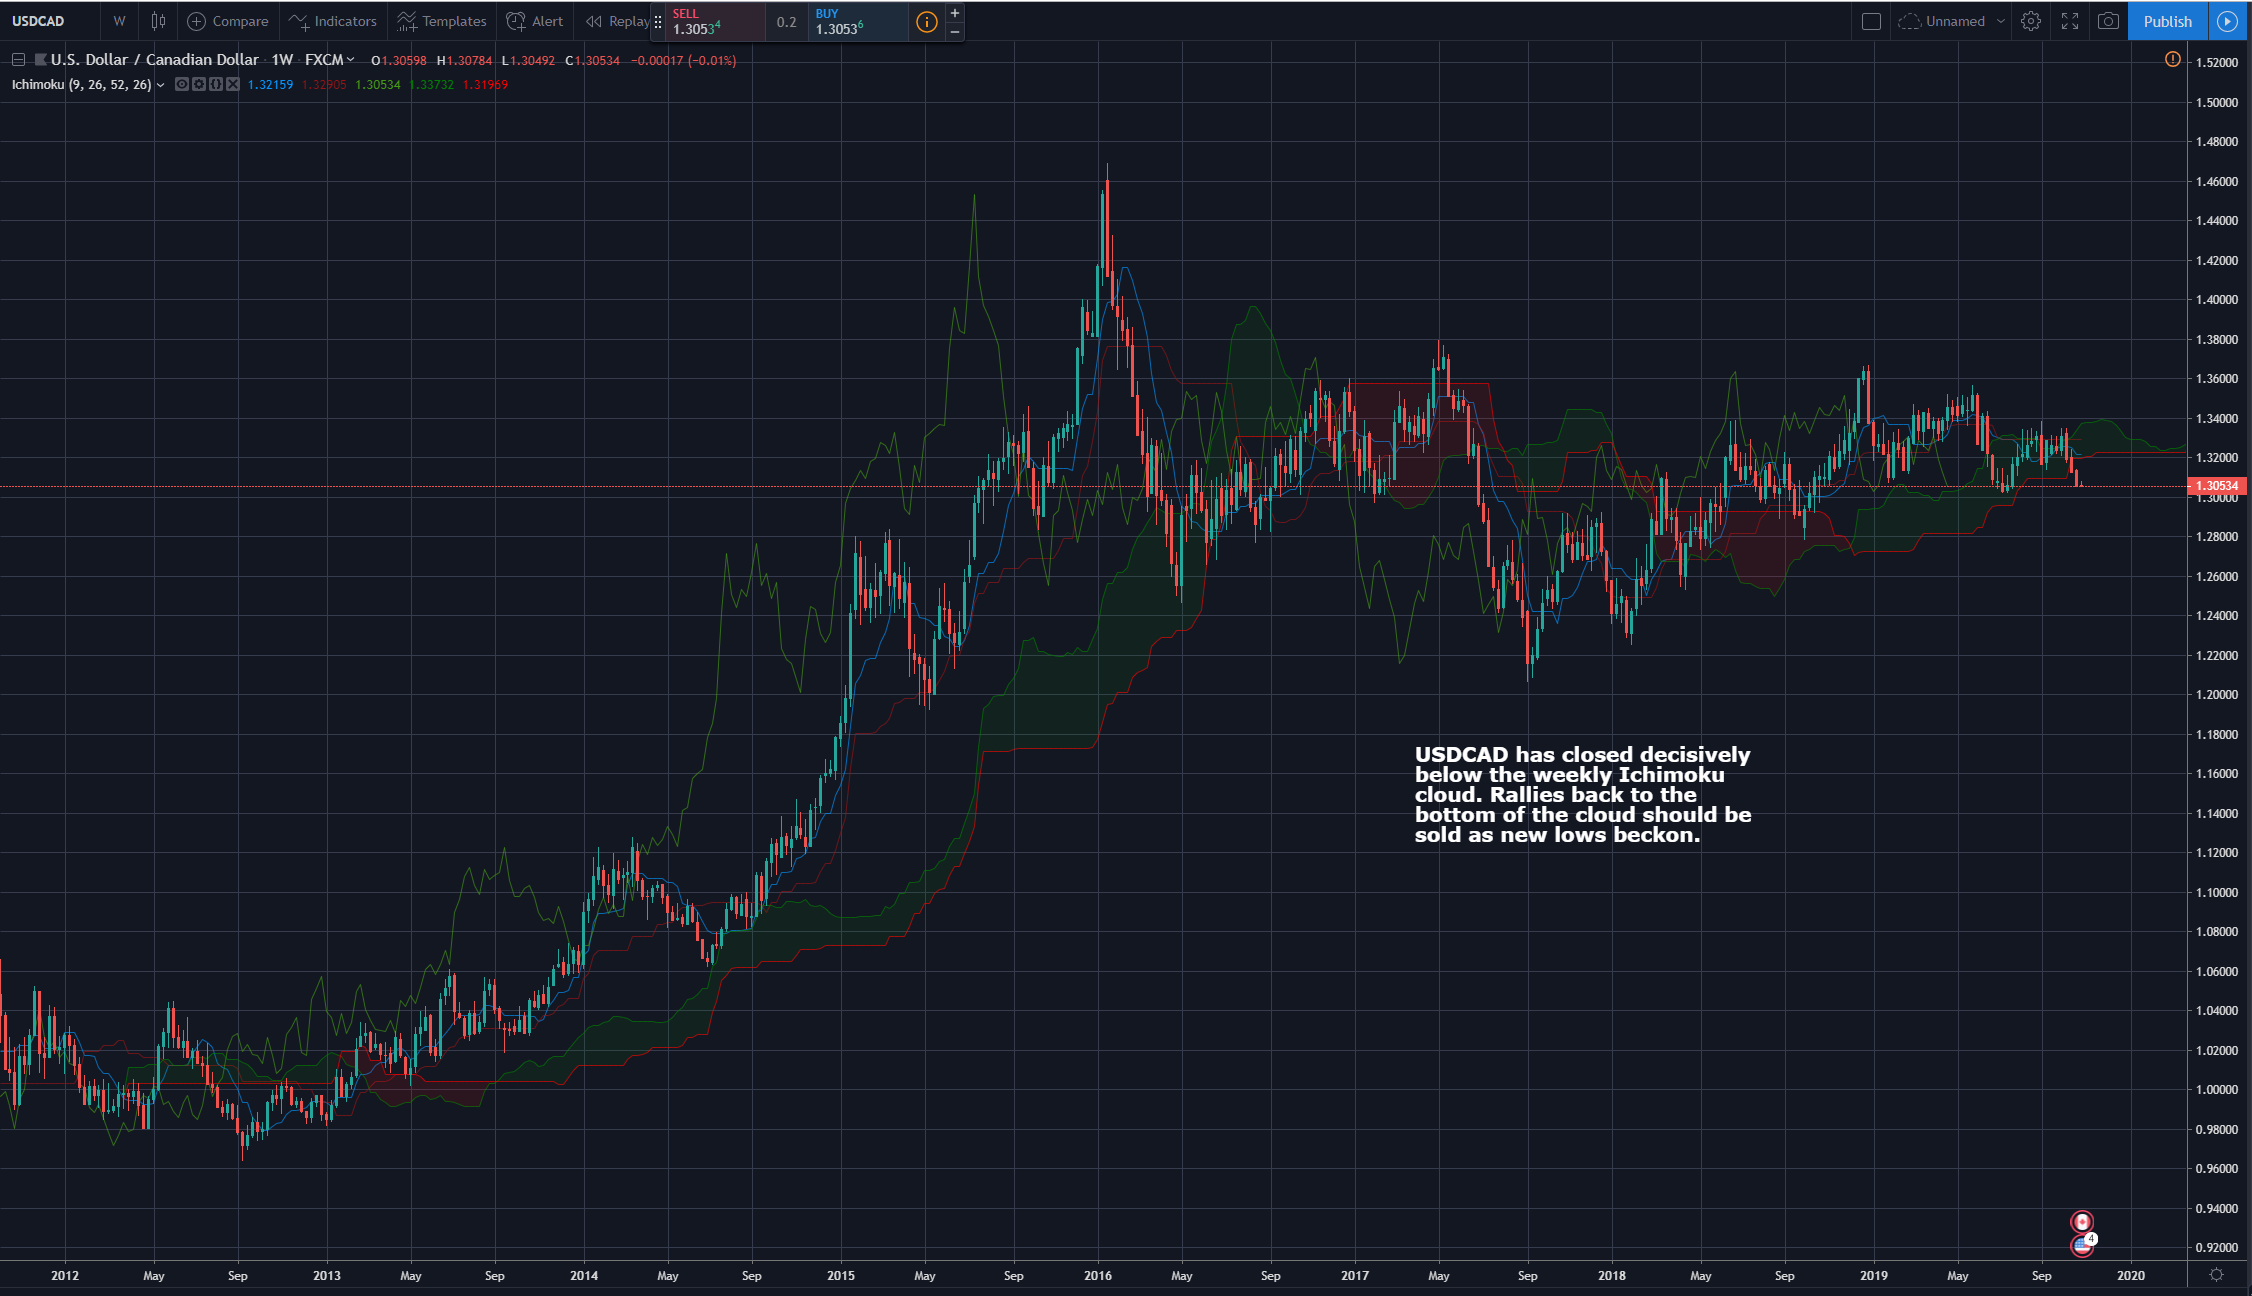
USD/CAD Weekly Candlesticks & Ichimoku Chart – SHORT
USDCAD has closed decisively below the weekly Ichimoku cloud. Rallies back to the bottom of the cloud should be sold as new lows beckon.
Vee, our Founder/CIO highlights patterns/formations on selected chart(s) every week which may have the potential to turn into trading opportunities. These charts are first sent out on Monday of the week to members subscribed to THE LONG & SHORT OF IT, which helps you to filter out the noise and condense only what’s important in the markets for the week ahead.
Disclaimer: The views and opinions expressed in this material do not constitute a recommendation by TrackRecord Pte. Ltd. that any particular investment, security, transaction or investment strategy is suitable for any specific person. No part of this material may be reproduced or transmitted in any form or by any means, electronic, mechanical, photocopying, recording, or otherwise, without prior written permission of TrackRecord Pte. Ltd
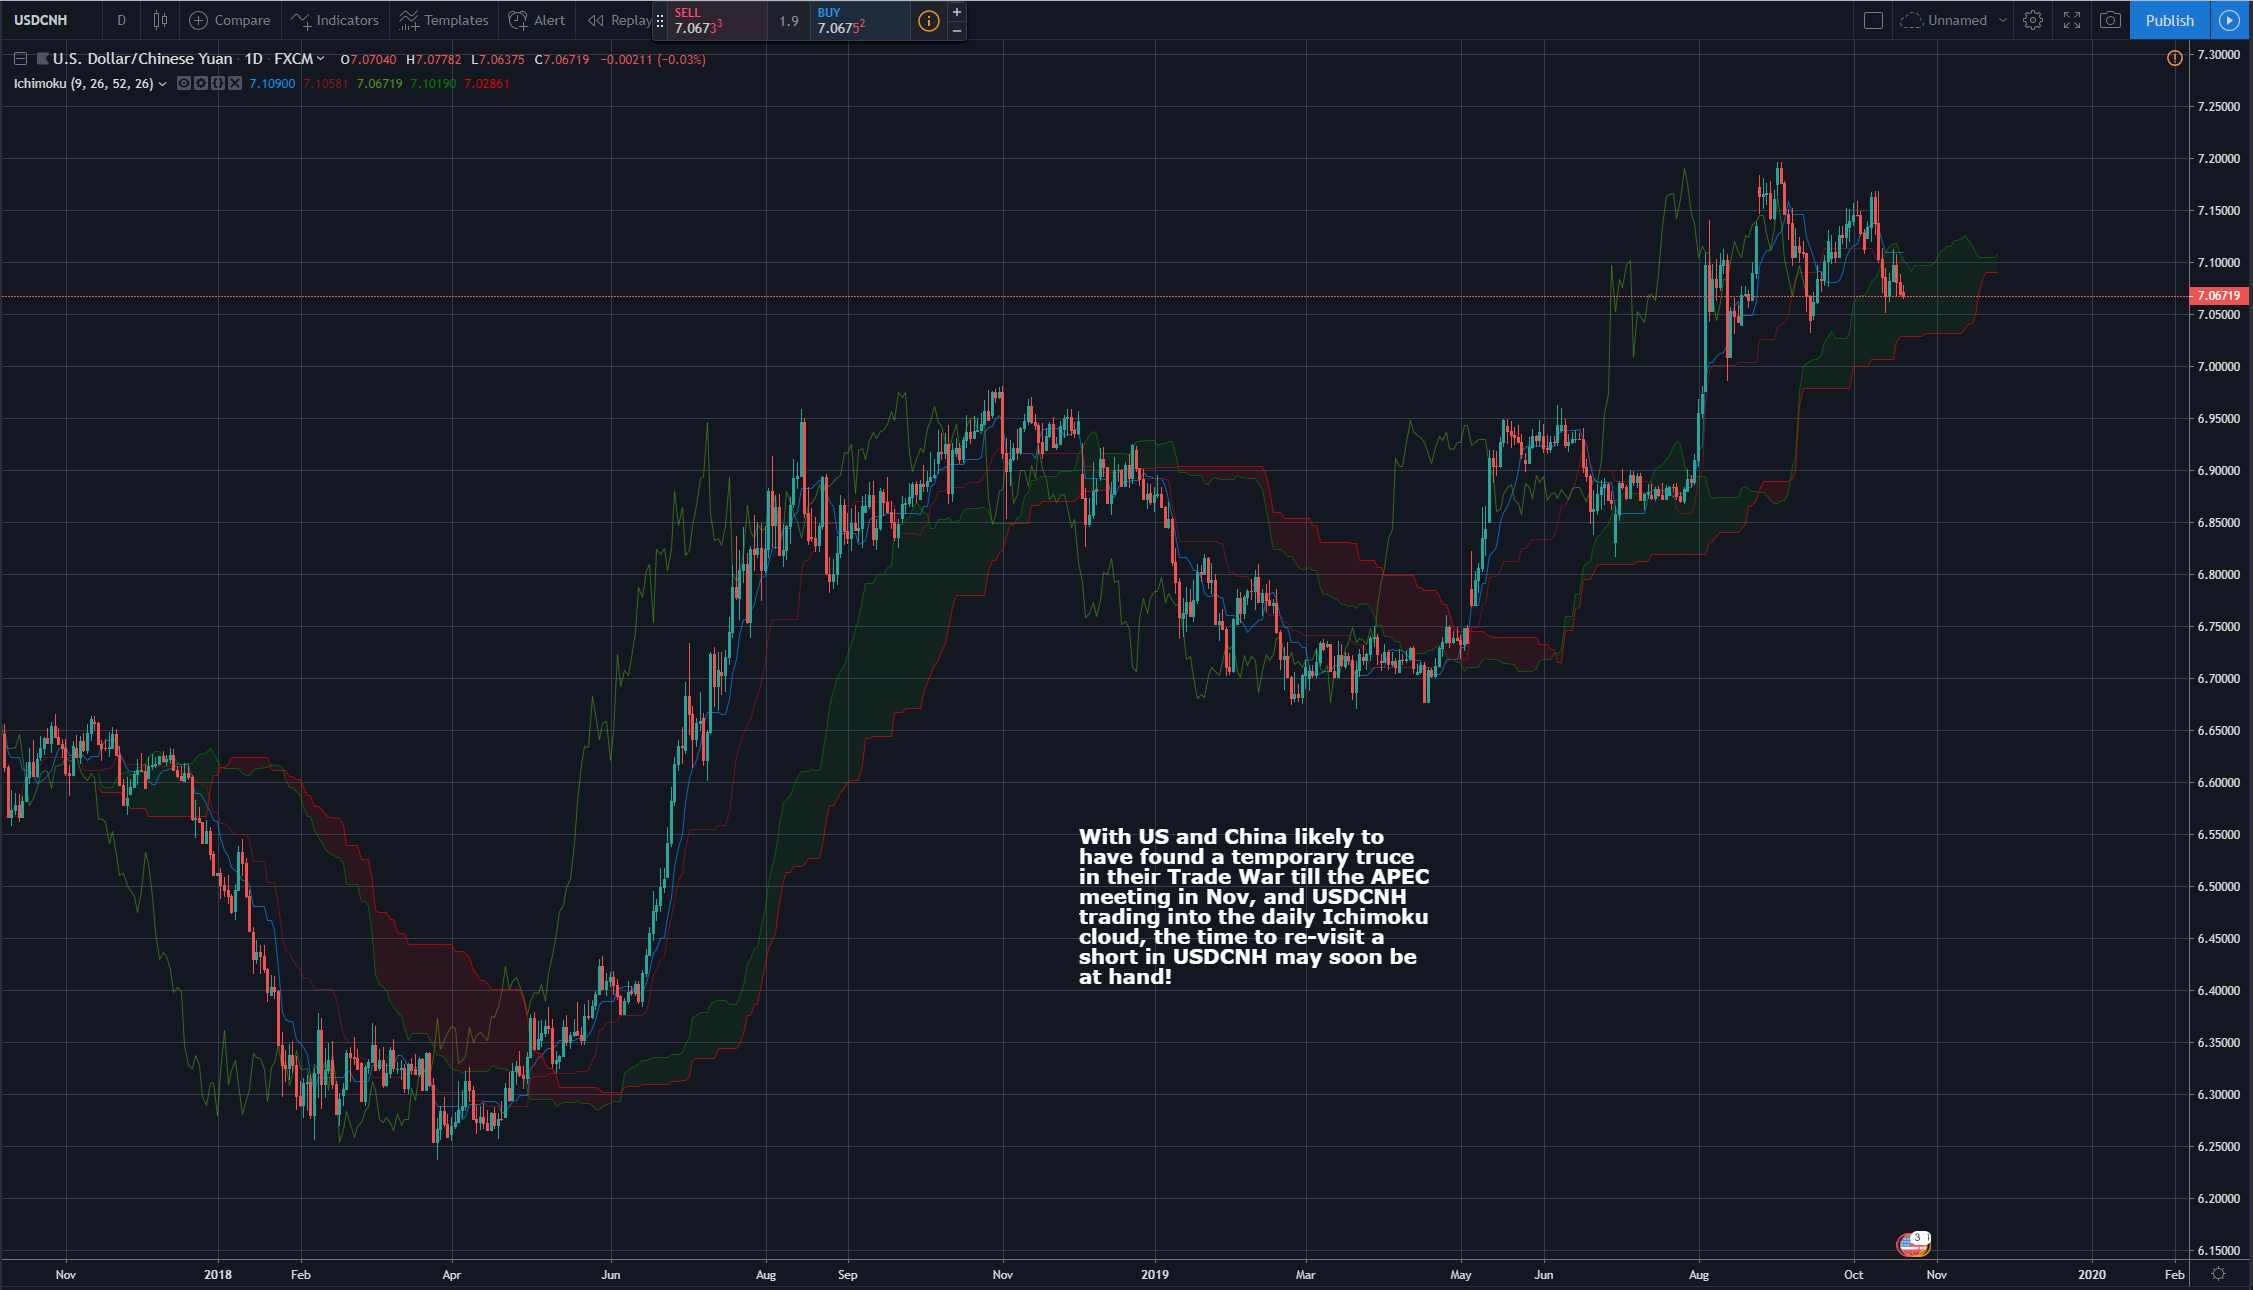
USD/CNH Daily Candlesticks & Ichimoku Chart – SHORT
With US and China likely to have found a temporary truce in their Trade War till the APEC meeting in Nov, and USDCNH trading into the daily Ichimoku cloud, the time to re-visit a short in USDCNH may soon be at hand!
Vee, our Founder/CIO highlights patterns/formations on selected chart(s) every week which may have the potential to turn into trading opportunities. These charts are first sent out on Monday of the week to members subscribed to THE LONG & SHORT OF IT, which helps you to filter out the noise and condense only what’s important in the markets for the week ahead.
Disclaimer: The views and opinions expressed in this material do not constitute a recommendation by TrackRecord Pte. Ltd. that any particular investment, security, transaction or investment strategy is suitable for any specific person. No part of this material may be reproduced or transmitted in any form or by any means, electronic, mechanical, photocopying, recording, or otherwise, without prior written permission of TrackRecord Pte. Ltd
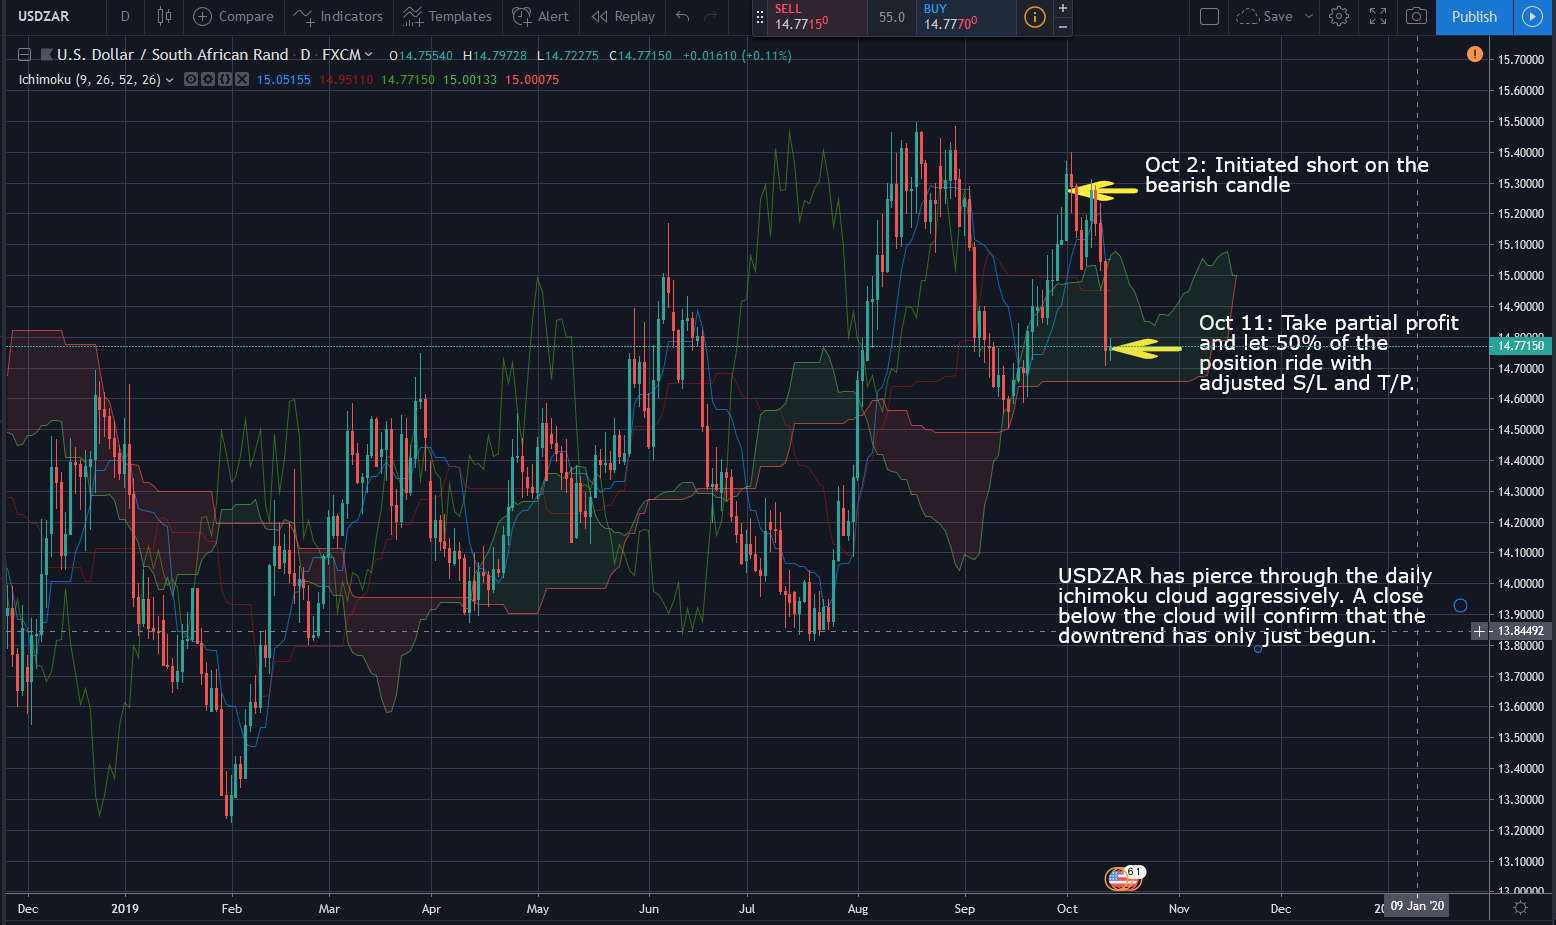
USD/ZAR Daily Candlesticks & Ichimoku Chart – SHORT
Oct 2: Initiated short on the bearish candle
Oct 11: Took partial profits and let 50% of the position ride with adjusted S/L and T/P (For actual adjusted levels, click here)
USDZAR has pierced through the daily ichimoku cloud aggressively. A close below the cloud will confirm that the downtrend has only just begun.
Vee, our Founder/CIO highlights patterns/formations on selected chart(s) every week which may have the potential to turn into trading opportunities. These charts are first sent out on Monday of the week to members subscribed to THE LONG & SHORT OF IT, which helps you to filter out the noise and condense only what’s important in the markets for the week ahead.
Disclaimer: The views and opinions expressed in this material do not constitute a recommendation by TrackRecord Pte. Ltd. that any particular investment, security, transaction or investment strategy is suitable for any specific person. No part of this material may be reproduced or transmitted in any form or by any means, electronic, mechanical, photocopying, recording, or otherwise, without prior written permission of TrackRecord Pte. Ltd
