
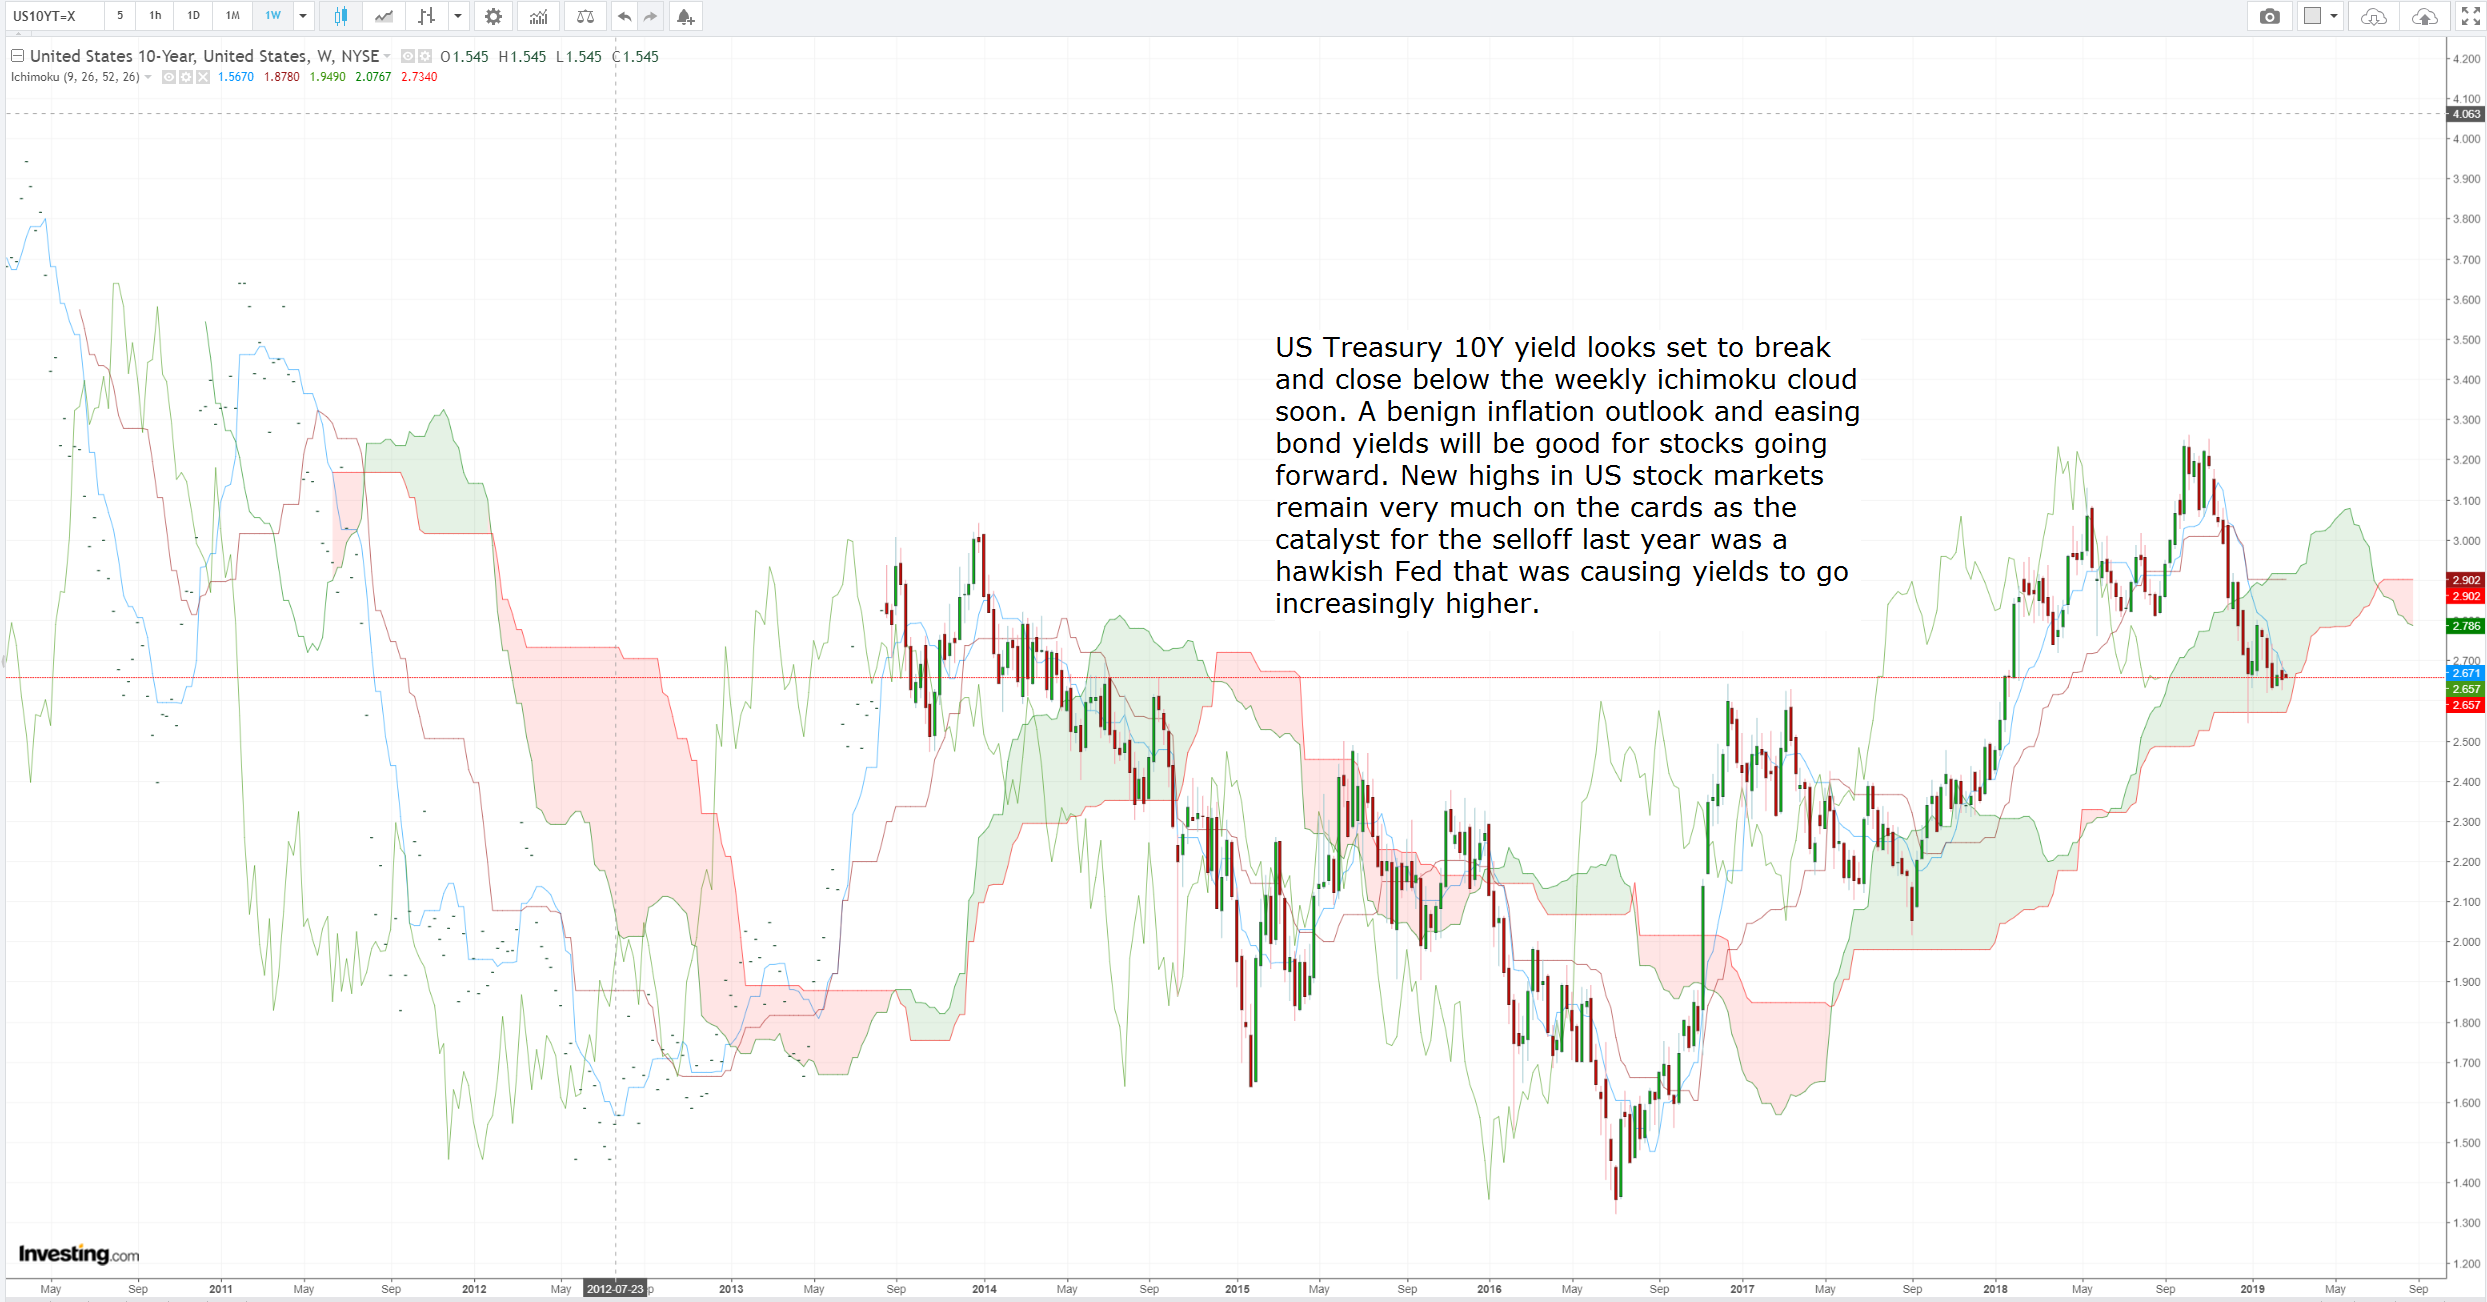
US Treasury 10Y Yield Weekly Candlesticks & Ichimoku Chart
US Treasury 10Y yield looks set to break and close below the weekly ichimoku cloud soon. A benign inflation outlook and easing bond yields will be good for stocks going forward. New highs in US stock markets remain very much on the cards as the catalyst for the selloff last year was a hawkish Fed that was causing yields to go increasingly higher.
Vee, our Founder/CIO highlights patterns/formations on selected chart(s) every week which may have the potential to turn into trading opportunities. These charts are first sent out on Monday of the week to members subscribed to THE LONG & SHORT OF IT, which helps you to filter out the noise and condense only what’s important in the markets for the week ahead.
Disclaimer: The views and opinions expressed in this material do not constitute a recommendation by TrackRecord Pte. Ltd. that any particular investment, security, transaction or investment strategy is suitable for any specific person. No part of this material may be reproduced or transmitted in any form or by any means, electronic, mechanical, photocopying, recording, or otherwise, without prior written permission of TrackRecord Pte. Ltd