
Hang Seng Index Weekly Candlesticks & Ichimoku Chart
Hang Seng Stock Index looks extremely bearish on the weekly chart. It could trade to the low 20,000s in the months ahead. Look out below!
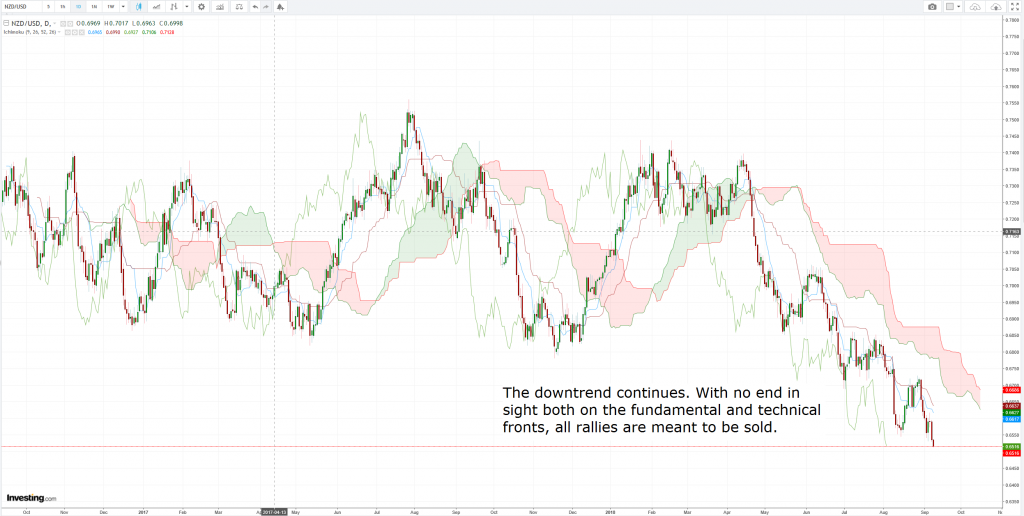
NZD/USD Daily Candlesticks & Ichimoku Chart
The downtrend continues. With no end in sight both on the fundamental and technical fronts, all rallies are meant to be sold.
Vee, our Founder/CIO highlights patterns/formations on selected chart(s) every week which may have the potential to turn into trading opportunities. These charts are extracts of our weekly subscription product – “CIO’s Week Ahead Update” which provides analysis for the week ahead, first sent out on Monday of the week.
Let us know what you think in the comments below!
Disclaimer: The views and opinions expressed in this material do not constitute a recommendation by TrackRecord Pte. Ltd. that any particular investment, security, transaction or investment strategy is suitable for any specific person. No part of this material may be reproduced or transmitted in any form or by any means, electronic, mechanical, photocopying, recording, or otherwise, without prior written permission of TrackRecord Pte. Ltd.