
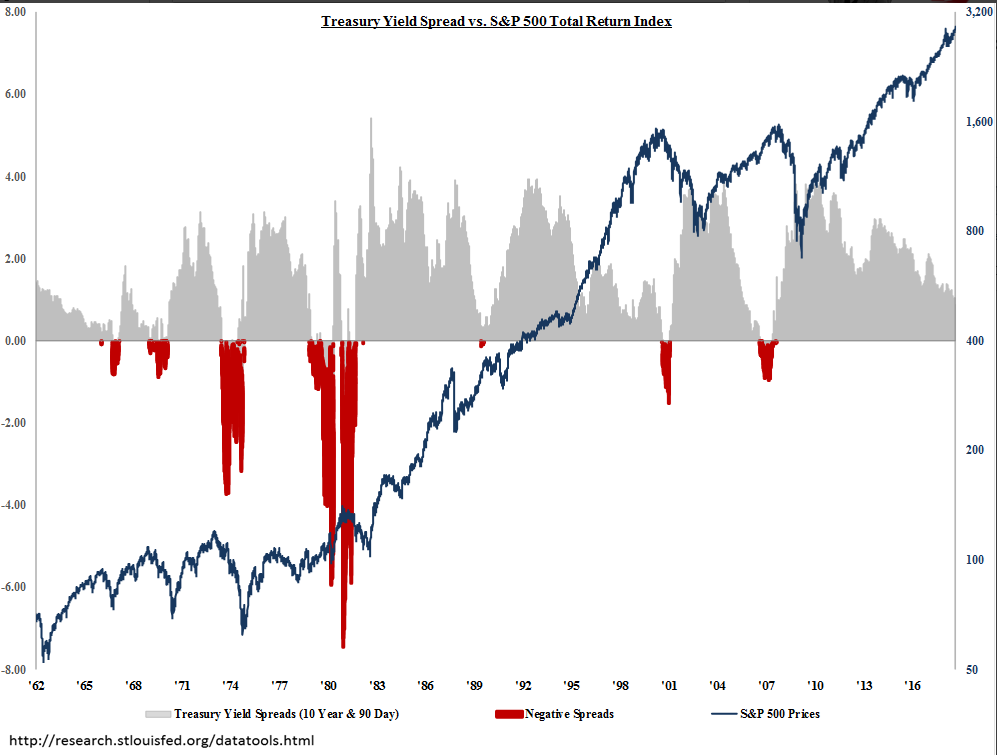
Chart of Spread between 10-yr and 3-month Treasury Yields vs S&P 500 Total Return Index
Note: Periods of curve inversion (i.e. when the 3-month Treasury yield is higher than that of the 10-year yield) led to periods of correction in the S&P500 Index. Currently the spread is still far from inversion territory despite all the attention on the flat 2-yr vs 10-yr Treasury spread.
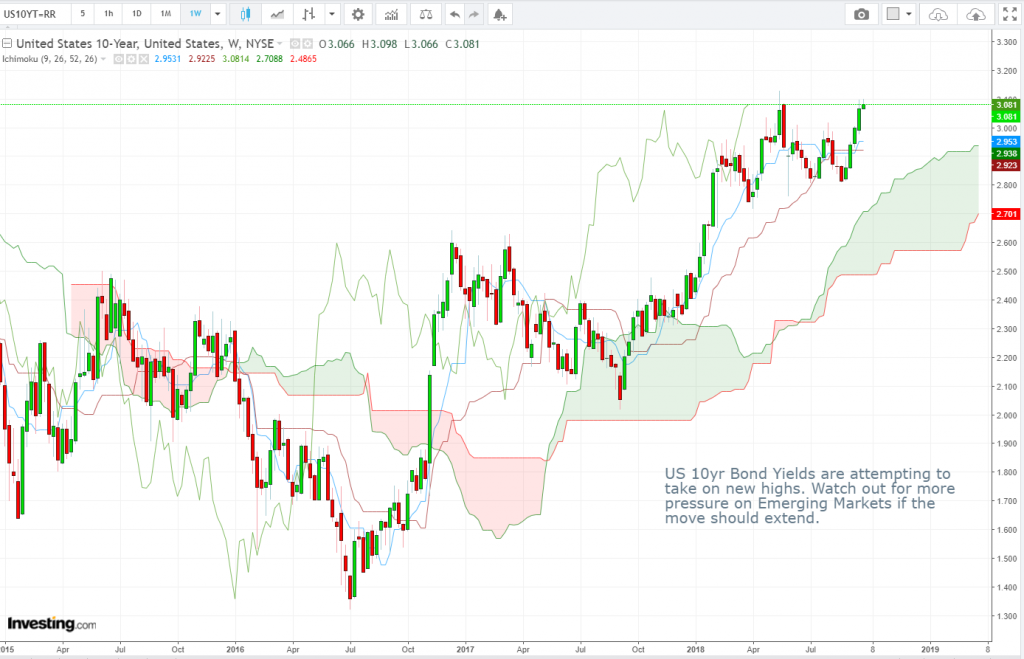
US 10-year Bond Yield Weekly Candlesticks & Ichimoku Chart
US 10yr Bond Yields are attempting to take on new highs. Watch out for more pressure on Emerging Markets if the move should extend.
Vee, our Founder/CIO highlights patterns/formations on selected chart(s) every week which may have the potential to turn into trading opportunities. These charts are extracts of our weekly subscription product – “CIO’s Week Ahead Update” which provides analysis for the week ahead, first sent out on Monday of the week.
Let us know what you think in the comments below!
Disclaimer: The views and opinions expressed in this material do not constitute a recommendation by TrackRecord Pte. Ltd. that any particular investment, security, transaction or investment strategy is suitable for any specific person. No part of this material may be reproduced or transmitted in any form or by any means, electronic, mechanical, photocopying, recording, or otherwise, without prior written permission of TrackRecord Pte. Ltd.