GBP/USD Weekly Candlesticks & Ichimoku Chart
GBP/USD has repeatedly tried to break above the Weekly Ichimoku Cloud but with each failure, the risk on move to new lows increases.
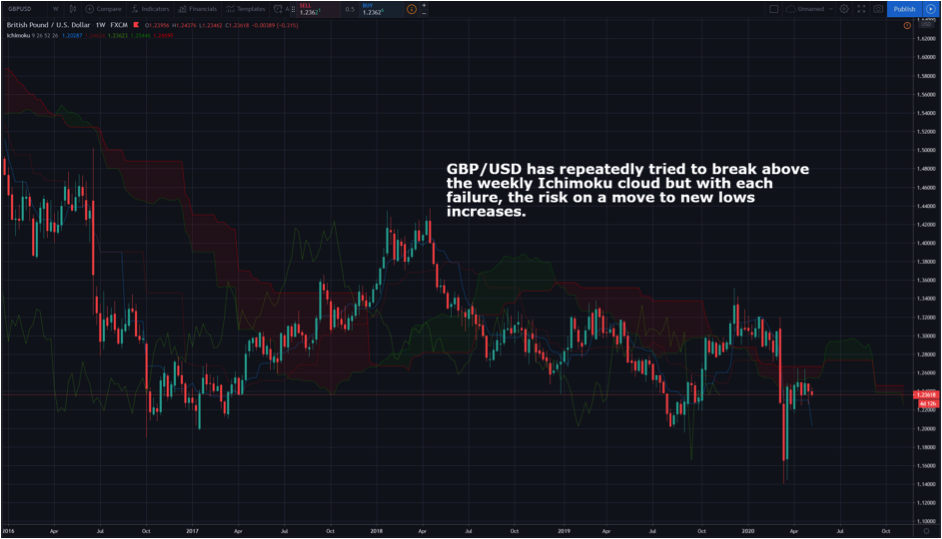
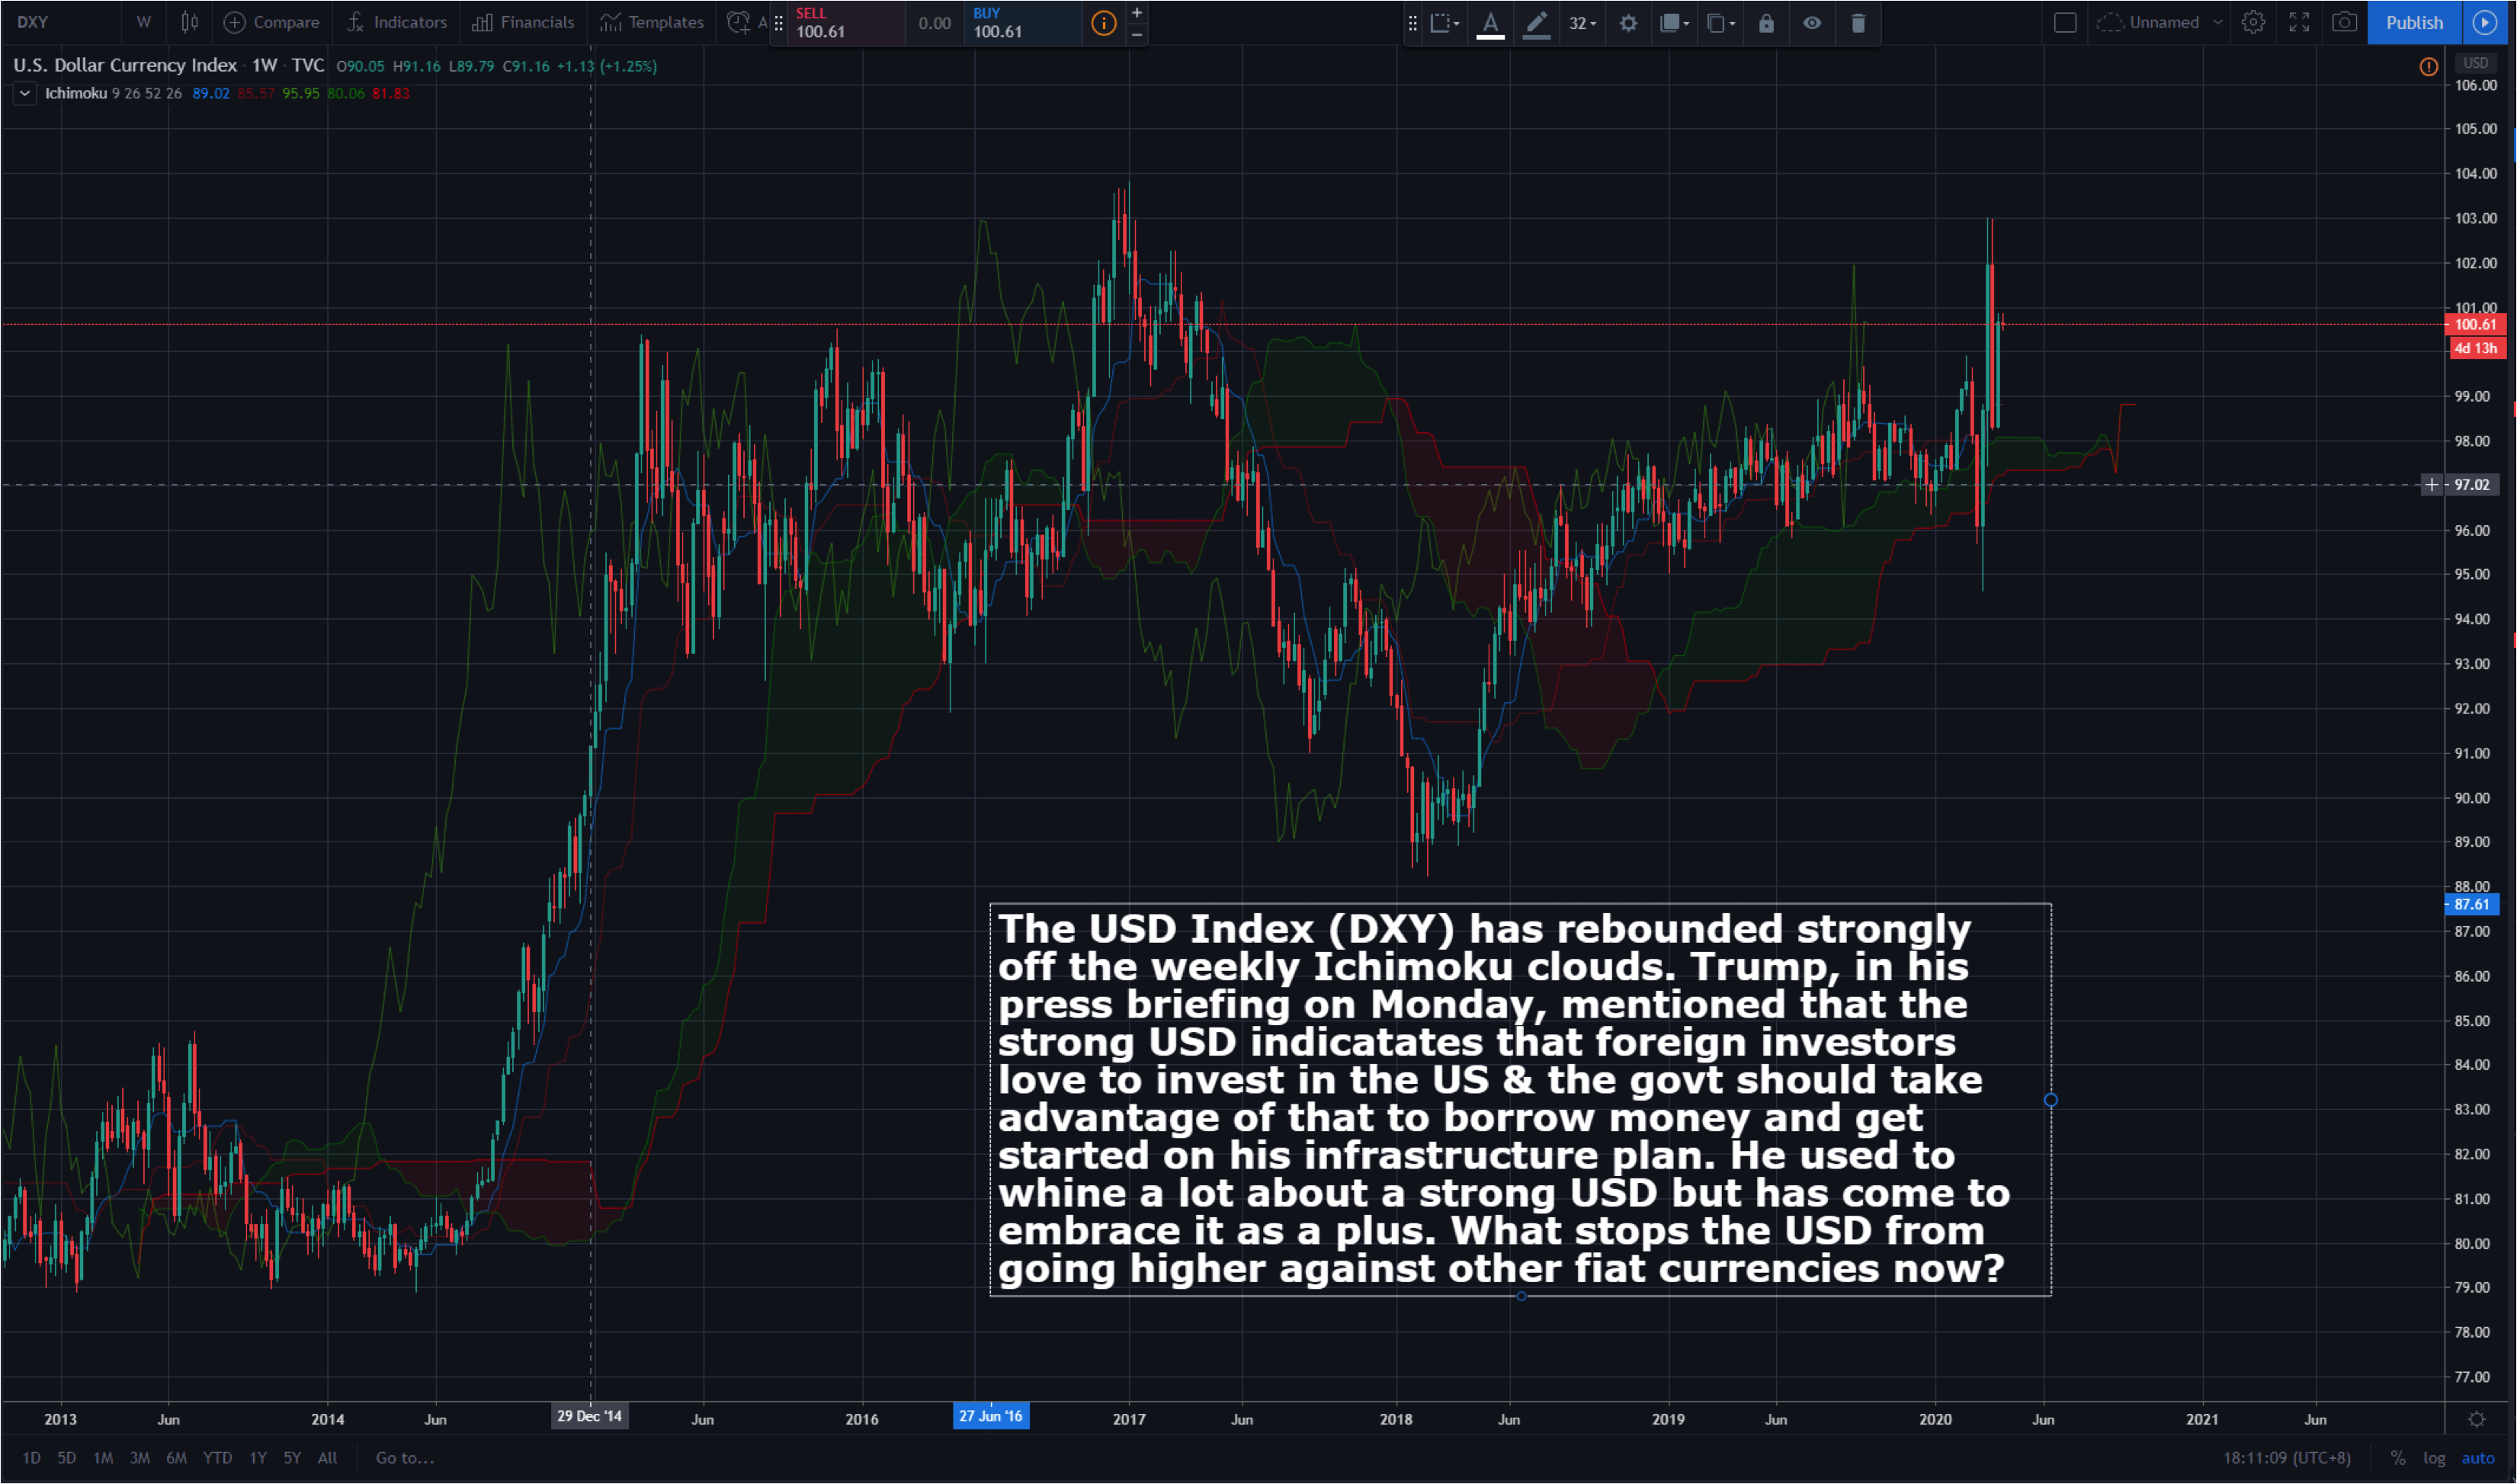
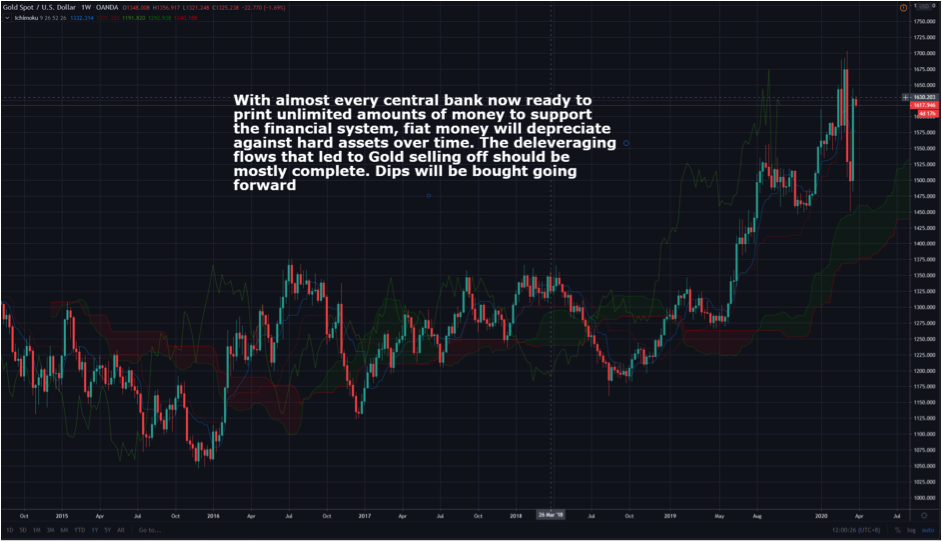
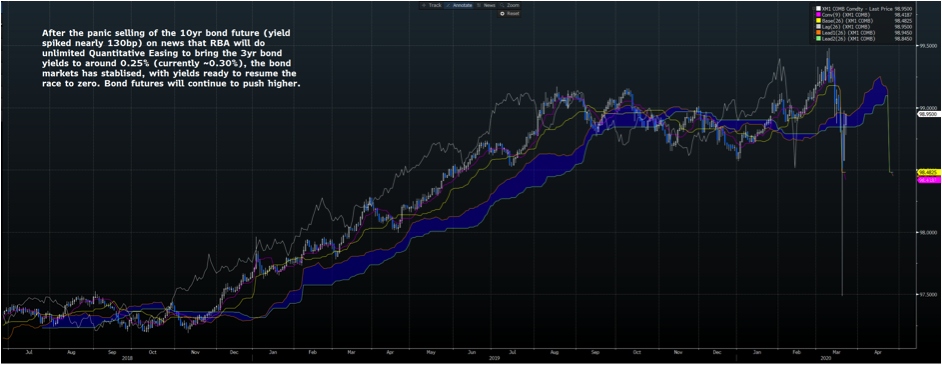
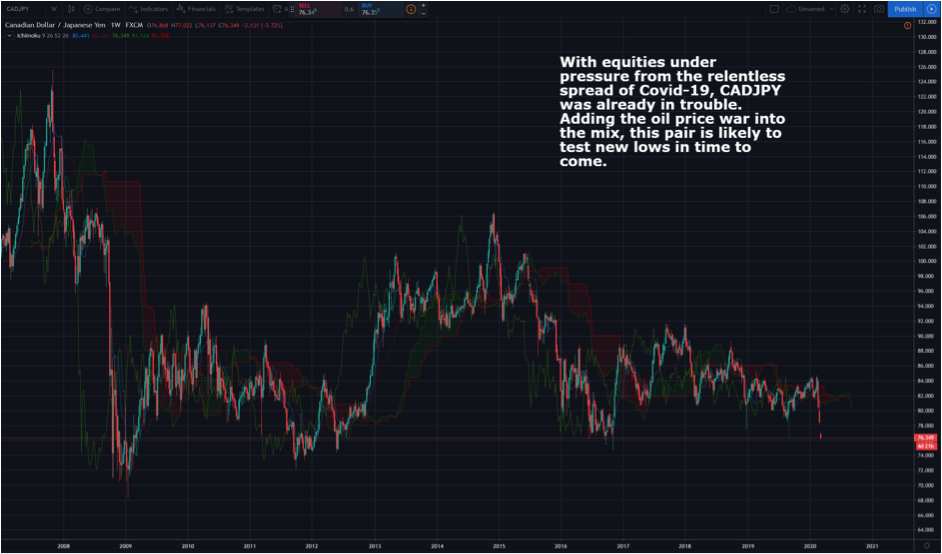
Source: tradingview.com
Vee, our Founder/CIO highlights patterns/formations on selected chart(s) every week which may have the potential to turn into trading opportunities. These charts are first sent out on Monday of the week to the TRACKRECORD COMMUNITY which helps them to filter out the noise and condense only what’s important in the markets for the week ahead.
Disclaimer: The views and opinions expressed in this material do not constitute a recommendation by TrackRecord Pte. Ltd. that any particular investment, security, transaction or investment strategy is suitable for any specific person. No part of this material may be reproduced or transmitted in any form or by any means, electronic, mechanical, photocopying, recording, or otherwise, without prior written permission of TrackRecord Pte. Ltd