Charts of the Week (5 Jun 2018)

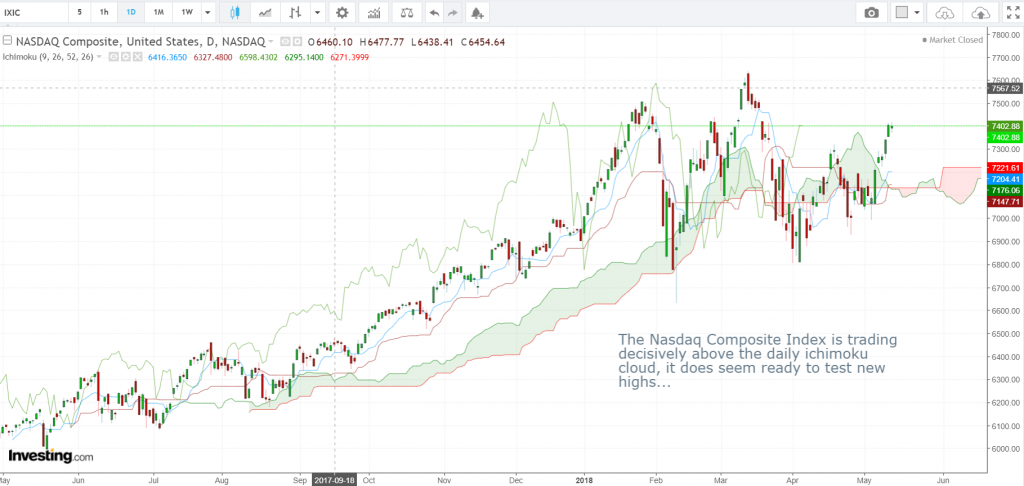
Nasdaq Daily Candlesticks & Ichimoku Chart  
Nasdaq posted a new closing high yesterday. As pointed out in our 14 May report, after a few months of consolidation, the market is poised for higher highs!


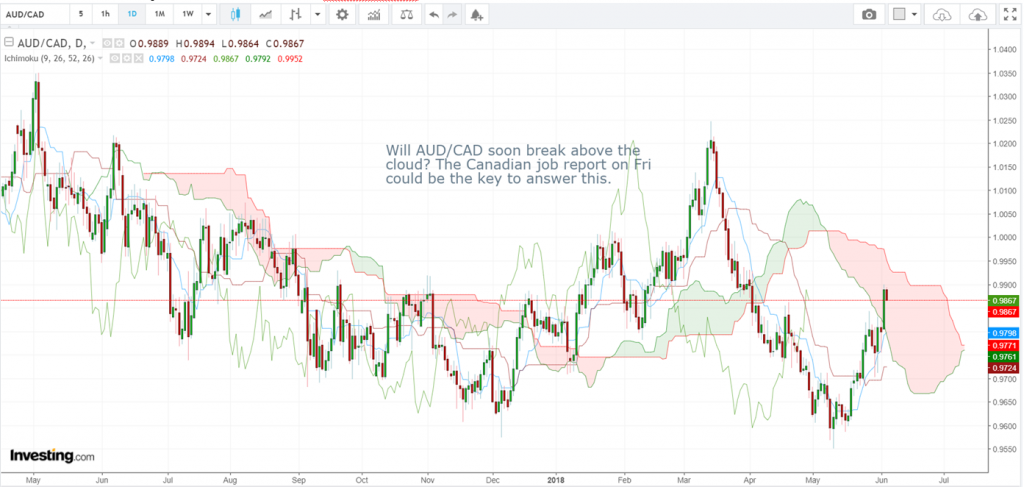
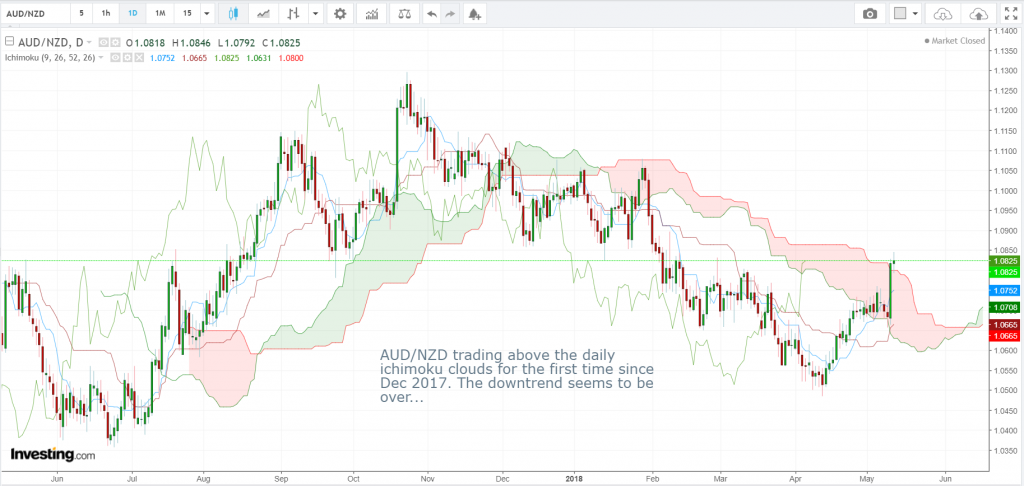
AUD/CAD Daily Candlesticks & Ichimoku Chart
Will AUD/CAD soon break above the cloud? The Canadian job report on Fri could be the key to answer this.


Vee, our Founder/CIO highlights patterns/formations on selected chart(s) every week which may have the potential to turn into trading opportunities.

These charts are extracts of our weekly subscription product – “CIO’s Week Ahead Update” which provides analysis for the week ahead, first sent out on Monday of the week.

Want to receive first hand information on these charts and learn how to leverage on possible trading opportunities? Click here!

Charts of the Week (21 May 2018)

EUR/USD Weekly Candlesticks & Ichimoku Chart 
EUR/USD reaching support on the weekly Ichimoku cloud soon.


CAD/JPY Daily Candlesticks & Ichimoku Chart 
CAD/JPY now firmly trading above the daily Ichimoku clouds


Vee, our Founder/CIO highlights patterns/formations on selected chart(s) every week which may have the potential to turn into trading opportunities.

These charts are extracts of our weekly subscription product – “CIO’s Week Ahead Update” which provides analysis for the week ahead, first sent out on Monday of the week.

Want to receive first hand information on these charts and learn how to leverage on possible trading opportunities? Click here!

Charts of the Week (14 May 2018)

AUD/NZD Daily Candlesticks & Ichimoku Chart 
AUD/NZD trading above the daily ichimoku clouds for the first time since Dec 2017. The downtrend seems to be over…


NASDAQ Composite Index Daily Candlesticks & Ichimoku Chart
The Nasdaq Composite Index is trading decisively above the daily Ichimoku cloud, it does seem ready to test new highs…


Vee, our Founder/CIO highlights patterns/formations on selected chart(s) every week which may have the potential to turn into trading opportunities.

These charts are extracts of our weekly subscription product – “CIO’s Week Ahead Update” which provides analysis for the week ahead, first sent out on Monday of the week.

Want to receive first hand information on these charts and learn how to leverage on possible trading opportunities? Click here!

Charts of the Week (7 May 2018)

US 10-year Treasury Yield Weekly Candlesticks & Ichimoku Chart 
The US 10-year treasury bond yield has been struggling to close above the psychological level of 3.00%. Is a retracement on the cards soon?


Apple (AAPL) Monthly Candlesticks & Ichimoku Chart
Apple (AAPL) broke to new highs last week on the back of a strong earnings report. Will this be the first trillion dollar company?


Vee, our Founder/CIO highlights patterns/formations on selected chart(s) every week which may have the potential to turn into trading opportunities. These charts are extracts of our weekly subscription product – “CIO’s Week Ahead Update” which provides analysis for the week ahead, first sent out on Monday of the week. Want to receive first hand information on these charts and learn how to leverage on possible trading opportunities? Click here!

Charts of the Week (23 April 2018)

AUD/USD Daily Candlesticks & Ichimoku Chart (Source: Tradingview.com)
AUD/USD reaching key support. A decisive break of 0.7630 – 40 level will open the downside to low 0.7500’s.


Ethereum/USD Daily Candlesticks & Ichimoku Chart (Source: Tradingview.com)
ETH/USD is breaking into the daily clouds. Is this the start of the next uptrend?


Vee, our Founder/CIO highlights patterns/formations on selected chart(s) every week which may have the potential to turn into trading opportunities. These charts are extracts of our weekly subscription product – “CIO’s Week Ahead Update” which provides analysis for the week ahead and how to leverage on possible trading opportunities! Click here to get access to more professional market analyses and insights! Now at 20% off with coupon code: 2YRPROMO

Charts of the Week (16 April 2018)

EUR/GBP Weekly Candlesticks & Ichimoku Chart
Is EUR/GBP now ready to break to new lows?


CHF/JPY Weekly Candlesticks & Ichimoku Chart
CHF/JPY appears ready to break through the bottom of the weekly Ichimoku clouds


Vee, our Founder/CIO highlights patterns/formations on selected chart(s) every week which may have the potential to turn into trading opportunities. These charts are extracts of our weekly subscription product – “CIO’s Week Ahead Update” which provides analysis for the week ahead and how to leverage on possible trading opportunities! Click here to get access to more professional market analyses and insights! Now at 20% off with coupon code: 2YRPROMO

Chart of the Week (9 April 2018)

EUR/CAD Daily Candlesticks & Ichimoku Chart
EUR/CAD is about to break the top of the Ichimoku clouds…


Vee, our Founder/CIO highlights patterns/formations on selected chart(s) every week which may have the potential to turn into trading opportunities. These charts are extracts of our weekly subscription product – “CIO’s Week Ahead Update” which provides analysis for the week ahead and how to leverage on possible trading opportunities! Click here to get access to more professional market analyses and insights! Now at 20% off with coupon code: 2YRPROMO

Charts of the Week: 2 April 2018

Facebook (FB) Weekly Candlesticks & Ichimoku Chart: Mixed signals: Price has pierced through the top of the weekly cloud, but there could be a bullish reversal hammer candle. This week’s price action will be critical.


EUR/USD Daily Candlesticks & Ichimoku Chart: Is EUR/USD poised for a correction lower?

Vee, our Founder/CIO highlights patterns/formations on two charts every week which may have the potential to turn into trading opportunities. These charts are extracts of our weekly subscription product – “CIO’s Week Ahead Update” which provides analysis for the week ahead and how to leverage on possible trading opportunities! Click here to get access to more professional market analyses and insights! Now at 20% off with coupon code: 2YRPROMO

Charts of the Week: 19 Mar 2018

Ethereum (ETH/USD) Daily Candlesticks & Ichimoku Chart: Will the sell off continue or will the support level of 400-450 hold?


CHF/JPY Weekly Candlesticks & Ichimoku Chart: CHF/JPY testing below the weekly ichimoku cloud. A close below will be extremely bearish.


Vee, our Founder/CIO highlights patterns/formations on two charts every week which may have the potential to turn into trading opportunities. These charts are part of our weekly subscription product – “CIO’s Week Ahead Update”Click here to get access to more professional market analyses and insights!  Now at 20% off with coupon code: 2YRPROMO. Valid till end of March.