Ethereum (ETH/USD) Daily Candlesticks & Ichimoku Chart: Will the sell off continue or will the support level of 400-450 hold?

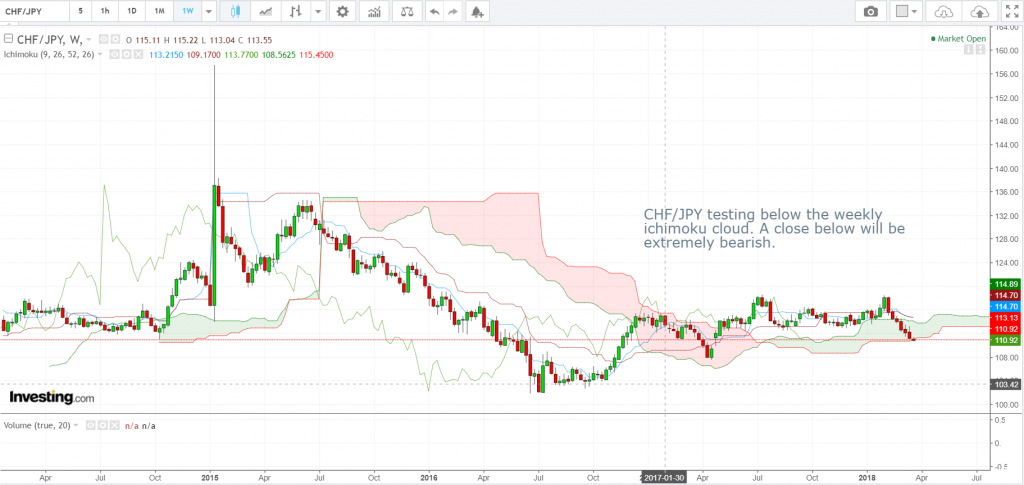
CHF/JPY Weekly Candlesticks & Ichimoku Chart: CHF/JPY testing below the weekly ichimoku cloud. A close below will be extremely bearish.
Vee, our Founder/CIO highlights patterns/formations on two charts every week which may have the potential to turn into trading opportunities. These charts are part of our weekly subscription product – “CIO’s Week Ahead Update”. Click here to get access to more professional market analyses and insights! Now at 20% off with coupon code: 2YRPROMO. Valid till end of March.
