
Facebook (FB) Weekly Candlesticks & Ichimoku Chart: Mixed signals: Price has pierced through the top of the weekly cloud, but there could be a bullish reversal hammer candle. This week’s price action will be critical.
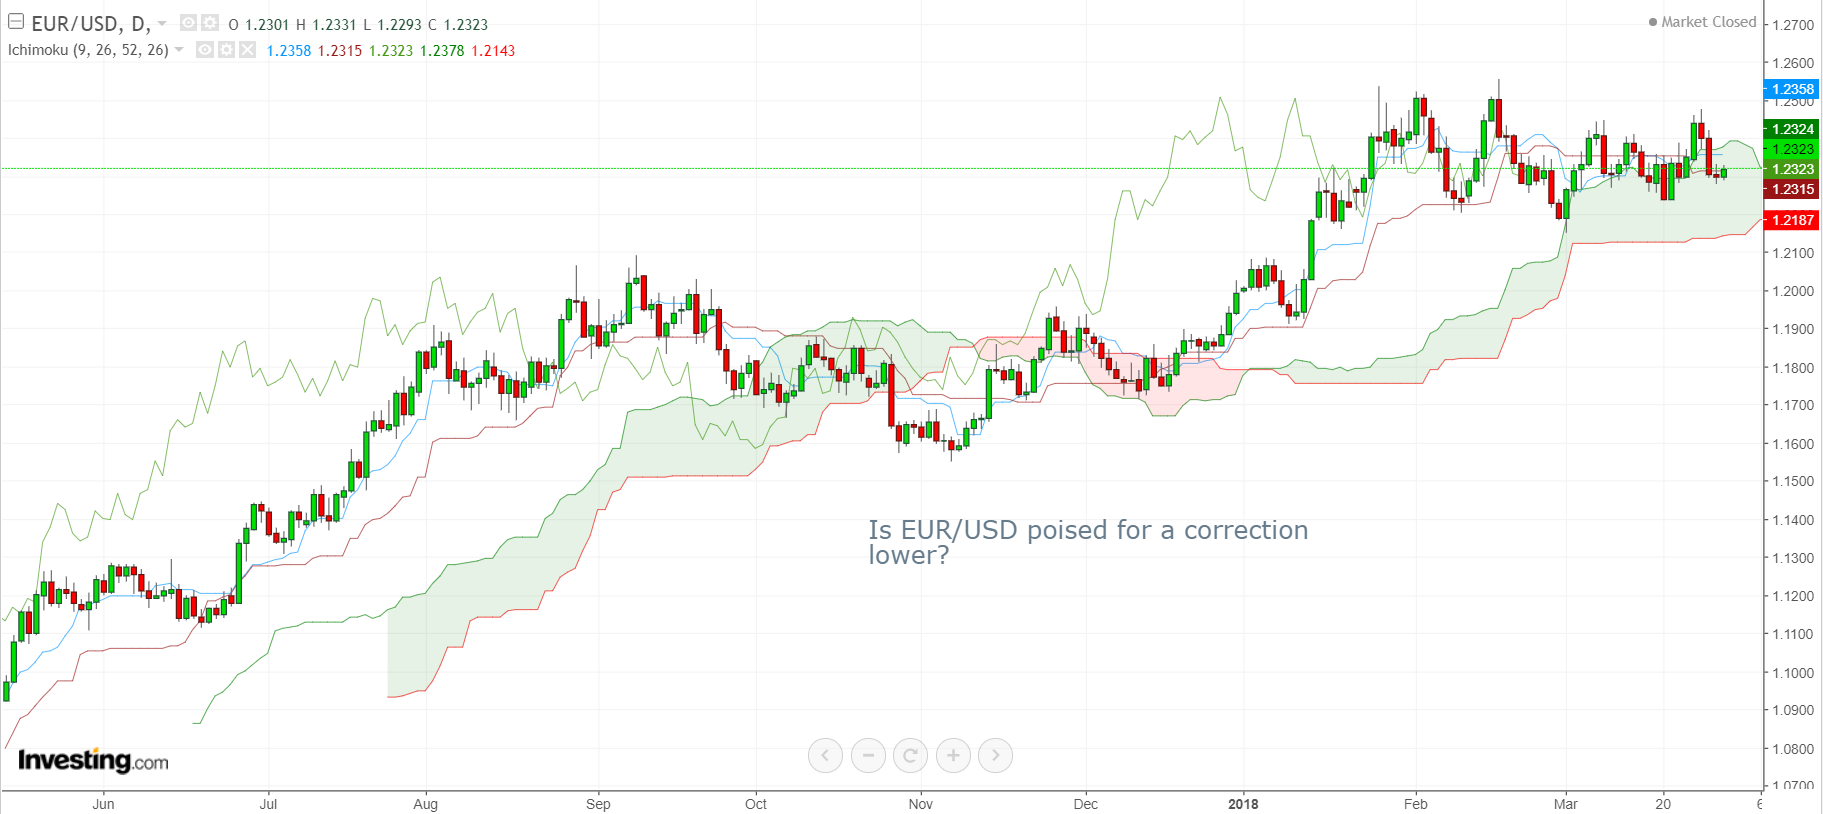
EUR/USD Daily Candlesticks & Ichimoku Chart: Is EUR/USD poised for a correction lower?
Vee, our Founder/CIO highlights patterns/formations on two charts every week which may have the potential to turn into trading opportunities. These charts are extracts of our weekly subscription product – “CIO’s Week Ahead Update” which provides analysis for the week ahead and how to leverage on possible trading opportunities! Click here to get access to more professional market analyses and insights! Now at 20% off with coupon code: 2YRPROMO