Charts of the Week (30 July 2018)

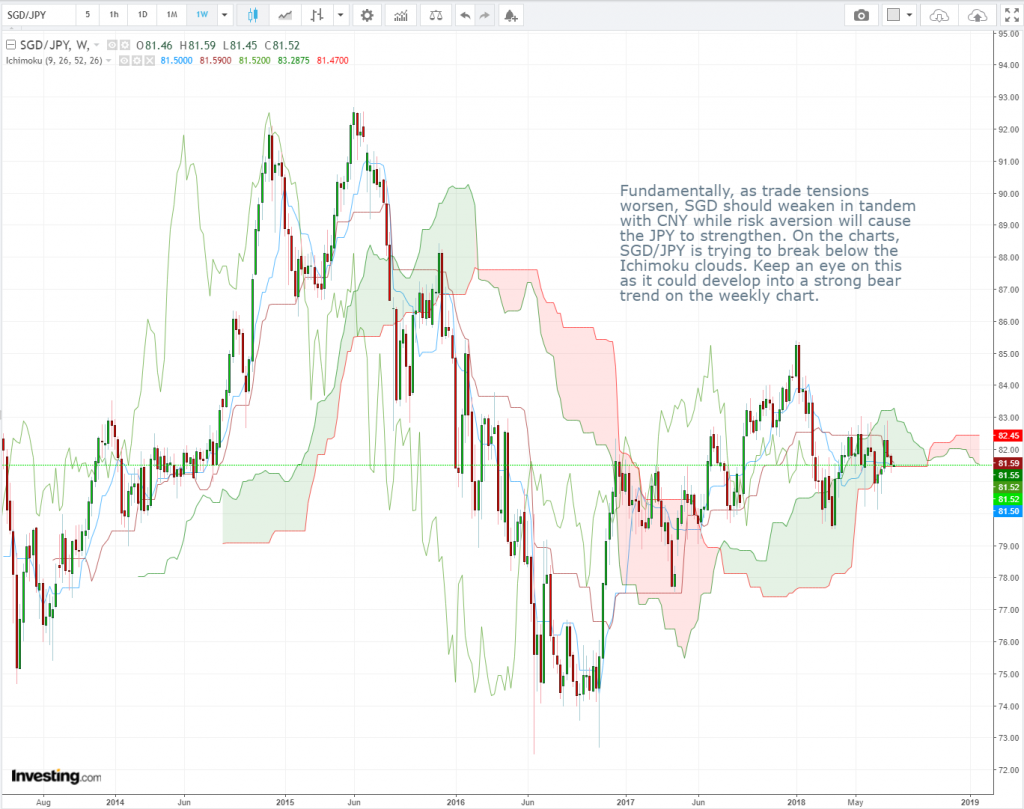
SGD/JPY Weekly Candlesticks & Ichimoku Chart
Fundamentally, as trade tensions worsen, SGD should weaken in tandem with CNY while risk aversion will cause JPY to strengthen. On the charts, SGD/JPY is trying to break below the Ichimoku clouds. Keep an eye on this as it could develop into a strong bear trend on the weekly chart.


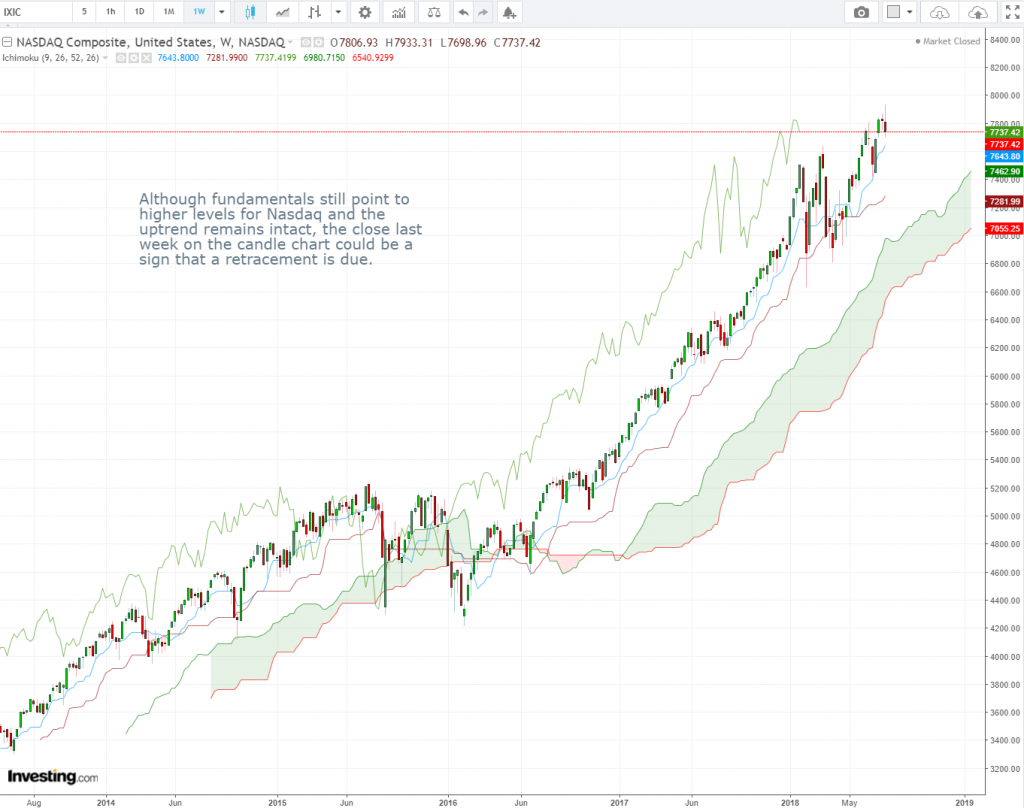
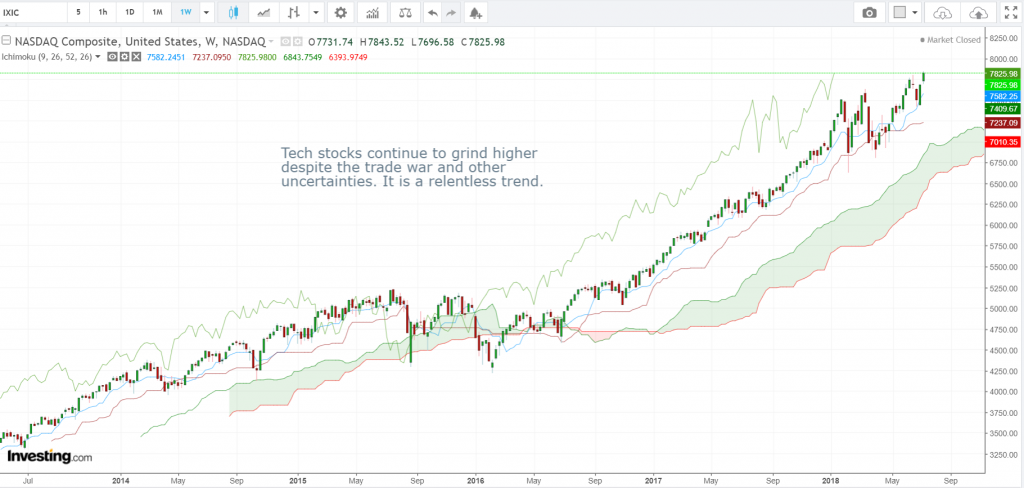
Nasdaq Composite Weekly Candlesticks & Ichimoku Chart
Although fundamentals still point to higher levels for Nasdaq and the uptrend remains intact, the close last week on the candle chart could be a sign that a retracement is due.


Vee, our Founder/CIO highlights patterns/formations on selected chart(s) every week which may have the potential to turn into trading opportunities. These charts are extracts of our weekly subscription product – “CIO’s Week Ahead Update” which provides analysis for the week ahead, first sent out on Monday of the week.

Receive first hand information on these charts and learn how to leverage on possible trading opportunities >>> Click here!


Disclaimer: The views and opinions expressed in this material do not constitute a recommendation by TrackRecord Pte. Ltd. that any particular investment, security, transaction or investment strategy is suitable for any specific person. No part of this material may be reproduced or transmitted in any form or by any means, electronic, mechanical, photocopying, recording, or otherwise, without prior written permission of TrackRecord Pte. Ltd.


Cryptocurrency News Update (30 July 2018)

Iran is planning to launch its own cryptocurrency: Iran is moving ahead with a plan to introduce a national cryptocurrency, partly as a way of busting U.S. sanctions. The Iranian government said in April that it had developed an experimental domestic cryptocurrency. With the U.S. having since pulled out of the Iran nuclear deal and restored more sanctions—a ban on buying U.S. dollars comes into force next month, and crude oil sanctions will follow in November. https://www.rt.com/business/434537-iran-national-cryptocurrency-oil/1. Iran is planning to launch its own cryptocurrency: Iran is moving ahead with a plan to introduce a national cryptocurrency, partly as a way of busting U.S. sanctions. The Iranian government said in April that it had developed an experimental domestic cryptocurrency. With the U.S. having since pulled out of the Iran nuclear deal and restored more sanctions—a ban on buying U.S. dollars comes into force next month, and crude oil sanctions will follow in November.

Crypto bank Galaxy Digital loses $134M in first quarter: Galaxy Digital, chaired by billionaire investor Michael Novogratz, said it saw a “net unrealized loss” of $85.5 million on digital assets, and a further $24 million loss on investments, totaling $109.6 million overall in its first-ever quarterly earnings report. The firm also spent $11 million in operating expenses and saw a $13.5 million loss from its income, resulting in roughly $134 million lost in the first quarter, according to the report.

‘Crowd psychology’ drives Bitcoin’s price, survey finds: According to a recent survey, more than half (52%) of the respondents said they believe crowd psychology is the main driver of the price of the No. 1 digital currency. “Finance professionals make their livings by analyzing asset values through the lens of fundamental/quantifiable factors. That more than half of respondents believe valuation in the crypto space is ‘purely a function of crowd psychology’ is refreshing in its honesty,” wrote Nicholas Colas, co-founder of DataTrek Research.

Cryptocurrency News Update (27 July 2018)

Coinbase finds no insider trading of Bitcoin Cash: Coinbase, the biggest U.S. cryptocurrency exchange, launched an inquiry last December into whether its employees engaged in improper trading related to the digital currency known as Bitcoin Cash. The company has wrapped up the investigation and concluded no wrongdoing took place.

Bitwise files with SEC to launch crypto ETF: Digital asset manager Bitwise has filed with the SEC to launch a regulated exchange-traded fund for cryptocurrency. The Bitwise HOLD 10 Cryptocurrency Index will include 10 cryptocurrencies, and will track the Bitwise HOLD 10 Private Index Fund that was founded in November.

Controversial blockchain project Tezos to be audited by PwC: The Tezos Foundation has announced that the international professional services giant PricewaterhouseCoopers Switzerland will conduct an external audit of its finances and operations. The project claims to be “committed to operating with the highest degree of integrity.”3. Controversial blockchain project Tezos to be audited by PwC: The Tezos Foundation has announced that the international professional services giant PricewaterhouseCoopers Switzerland will conduct an external audit of its finances and operations. The project claims to be “committed to operating with the highest degree of integrity.”

Singapore Airlines launches blockchain-based loyalty wallet: Singapore Airlines has launched its own airline loyalty digital wallet that uses blockchain technology. The software has been co-developed by Microsoft and KPMG Digital Village. The new wallet converts frequent flyer miles into digitized ‘KrisPay miles’ that can be used to pay for retail purchases via a mobile app.

TRON acquires major P2P platform operator BitTorrent: TRON’s long-rumored acquisition of BitTorrent Inc., the operator of popular torrent client uTorrent, has been confirmed by TRON founder Justin Sun. The BitTorrent protocol launched in 2001 and relies on distributed “seeding’” by users who upload shareable content.

Charts of the Week (23 Jul 2018)

GBP/USD Weekly Candlesticks & Ichimoku Chart
With GBP/USD piercing below the bottom of the weekly Ichimoku cloud, the long term downtrend has resumed. With the technical and fundamental outlook both pointing in the same direction, the lows of 1.2000 are likely to be revisited unless something changes dramatically in time to come.


GBP/EUR Weekly Candlesticks & Ichimoku Chart
With GBP/EUR also trading below the weekly Ichimoku cloud, the weakness of GBP is not just a symptom of USD strength. GBP could be facing dark days ahead…


Vee, our Founder/CIO highlights patterns/formations on selected chart(s) every week which may have the potential to turn into trading opportunities. These charts are extracts of our weekly subscription product – “CIO’s Week Ahead Update” which provides analysis for the week ahead, first sent out on Monday of the week.

Receive first hand information on these charts and learn how to leverage on possible trading opportunities >>> Click here!


Disclaimer: The views and opinions expressed in this material do not constitute a recommendation by TrackRecord Pte. Ltd. that any particular investment, security, transaction or investment strategy is suitable for any specific person. No part of this material may be reproduced or transmitted in any form or by any means, electronic, mechanical, photocopying, recording, or otherwise, without prior written permission of TrackRecord Pte. Ltd.

Charts of the Week (16 July 2018)

EUR/USD Daily Candlesticks & Ichimoku Chart 
Shorting EUR/USD against the bottom of the ichimoku cloud does seem like a good risk/reward trade based on the charts


Nasdaq (IXIC) Weekly Candlesticks & Ichimoku Chart
Tech stocks continue to grind higher despite the trade war and other uncertainties. It is a relentless trend.


Vee, our Founder/CIO highlights patterns/formations on selected chart(s) every week which may have the potential to turn into trading opportunities. These charts are extracts of our weekly subscription product – “CIO’s Week Ahead Update” which provides analysis for the week ahead, first sent out on Monday of the week.

Receive first hand information on these charts and learn how to leverage on possible trading opportunities >>> Click here!


Disclaimer: The views and opinions expressed in this material do not constitute a recommendation by TrackRecord Pte. Ltd. that any particular investment, security, transaction or investment strategy is suitable for any specific person. No part of this material may be reproduced or transmitted in any form or by any means, electronic, mechanical, photocopying, recording, or otherwise, without prior written permission of TrackRecord Pte. Ltd.

Charts of the Week (9 July 2018)

USD/MXN Weekly Candlesticks & Ichimoku Chart
USD/MXN is trying to break through the bottom of the weekly Ichimoku cloud. With the possible improvement of a working relationship between the new Mexican president and Trump, the fundamentals are also reaffirming what the technicals are indicating. A close below the cloud will be a good indicator that the weekly downtrend has begun.


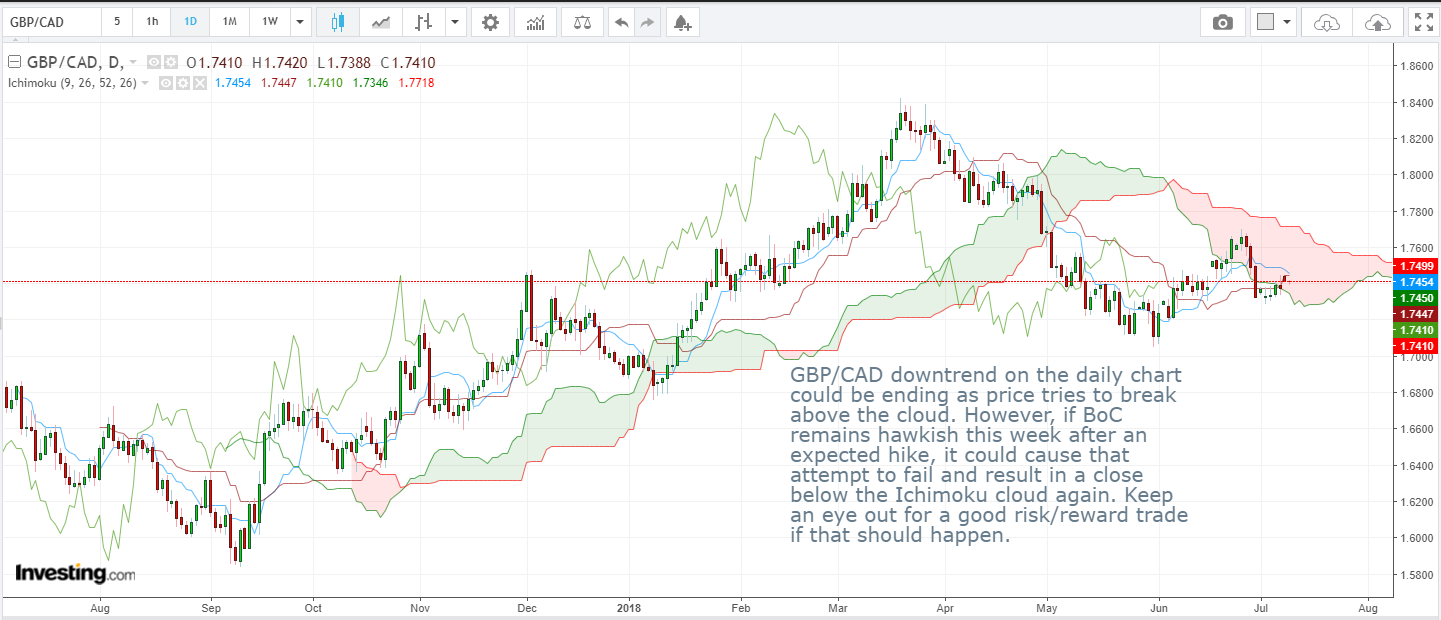
GBP/CAD Daily Candlesticks & Ichimoku Chart
GBP/CAD downtrend on the daily chart could be ending as price tries to break above the cloud. However, if BoC remains hawkish this week after an expected hike, it could cause that attempt to fail and result in a close below the Ichimoku cloud again. Keep an eye out for a good risk/reward trade if that should happen.


Vee, our Founder/CIO highlights patterns/formations on selected chart(s) every week which may have the potential to turn into trading opportunities. These charts are extracts of our weekly subscription product – “CIO’s Week Ahead Update” which provides analysis for the week ahead, first sent out on Monday of the week.

Receive first hand information on these charts and learn how to leverage on possible trading opportunities >>> Click here!


Disclaimer: The views and opinions expressed in this material do not constitute a recommendation by TrackRecord Pte. Ltd. that any particular investment, security, transaction or investment strategy is suitable for any specific person. No part of this material may be reproduced or transmitted in any form or by any means, electronic, mechanical, photocopying, recording, or otherwise, without prior written permission of TrackRecord Pte. Ltd.

Charts of the Week (2 July 2018)

NASDAQ Weekly Candlesticks & Ichimoku Chart
At the halfway mark of 2018, Nasdaq still looks to be in a long term uptrend despite higher volatility and a more uncertain macro environment. Is Trump’s trade war enough to stop this trend?


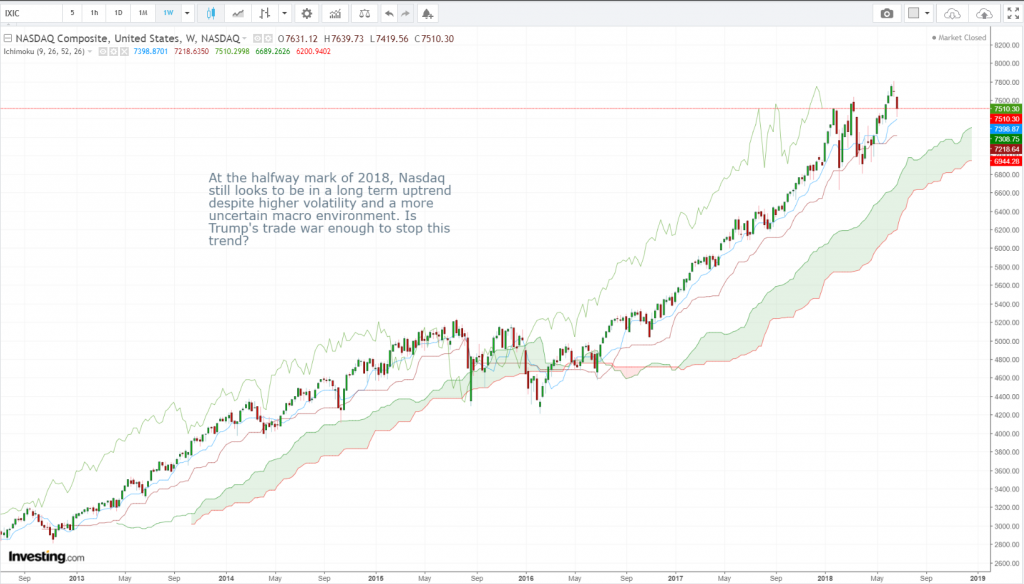
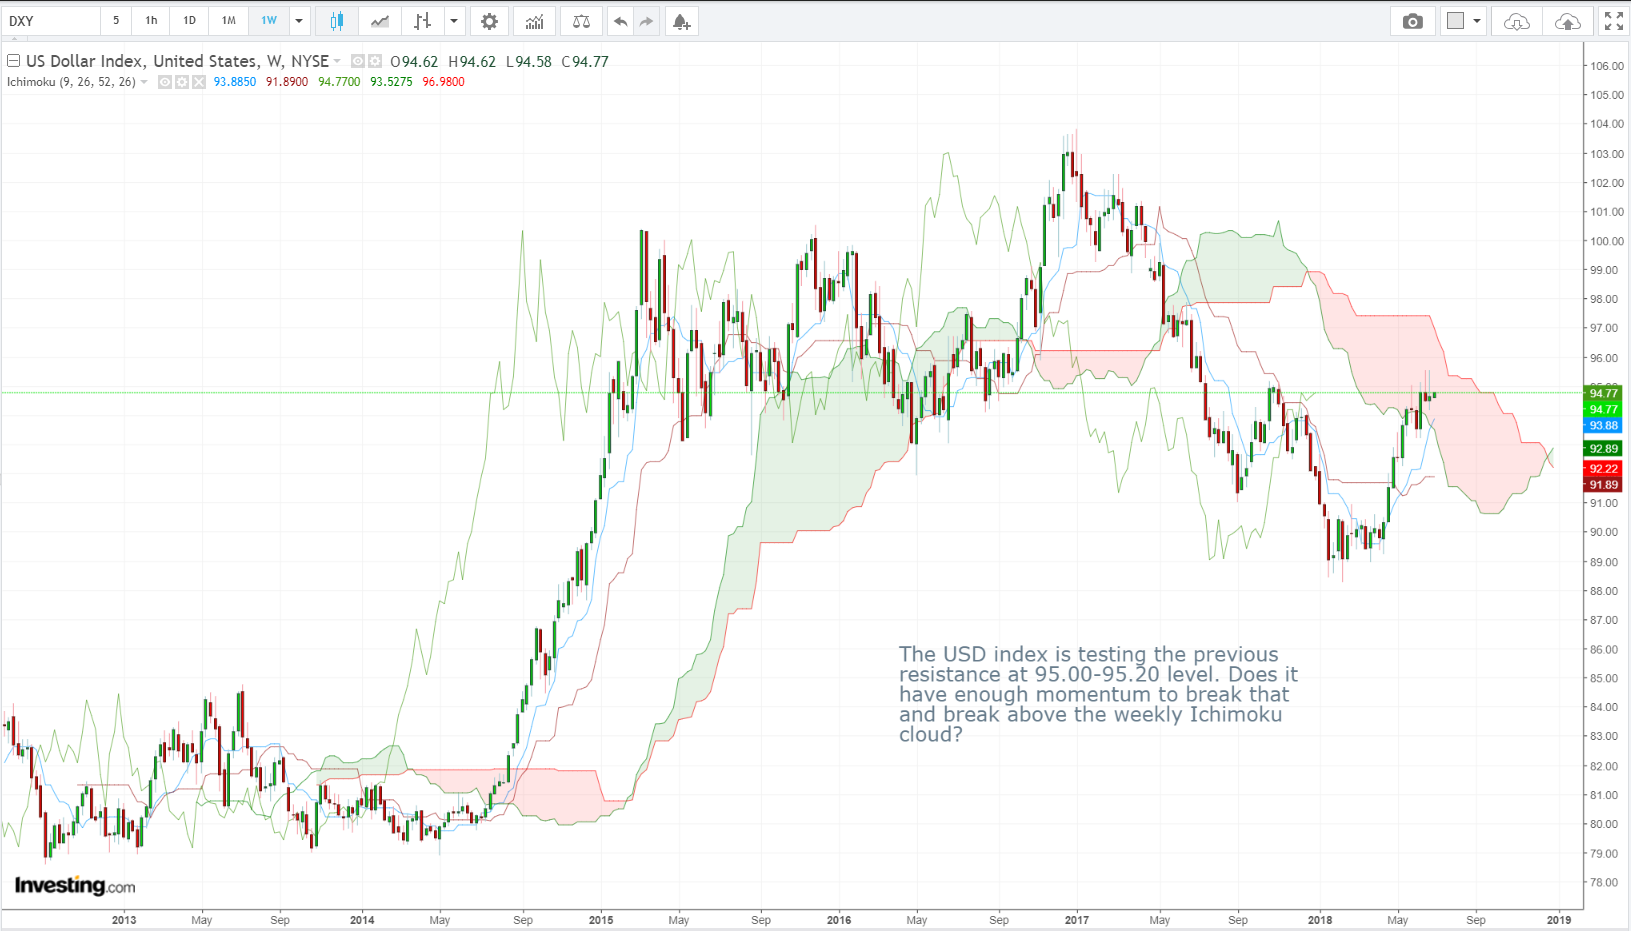
Dollar Index (DXY) Weekly Candlesticks & Ichimoku Chart
The USD index is testing the previous resistance at 95.00 – 95.20 level. Does it have enough momentum to break that and break above the weekly Ichimoku cloud?


Vee, our Founder/CIO highlights patterns/formations on selected chart(s) every week which may have the potential to turn into trading opportunities. These charts are extracts of our weekly subscription product – “CIO’s Week Ahead Update” which provides analysis for the week ahead, first sent out on Monday of the week.

Receive first hand information on these charts and learn how to leverage on possible trading opportunities >>> Click here!