Australian Stock Index, ASX200, Monthly Candlesticks & Ichimoku Chart
The Australian Stock Index (ASX200) tried to break into the monthly Ichimoku Cloud but failed so far. It will be coming under pressure in days ahead as early redemption for their retirement Superannuation fund will lead to more selling for cash by the asset managers.
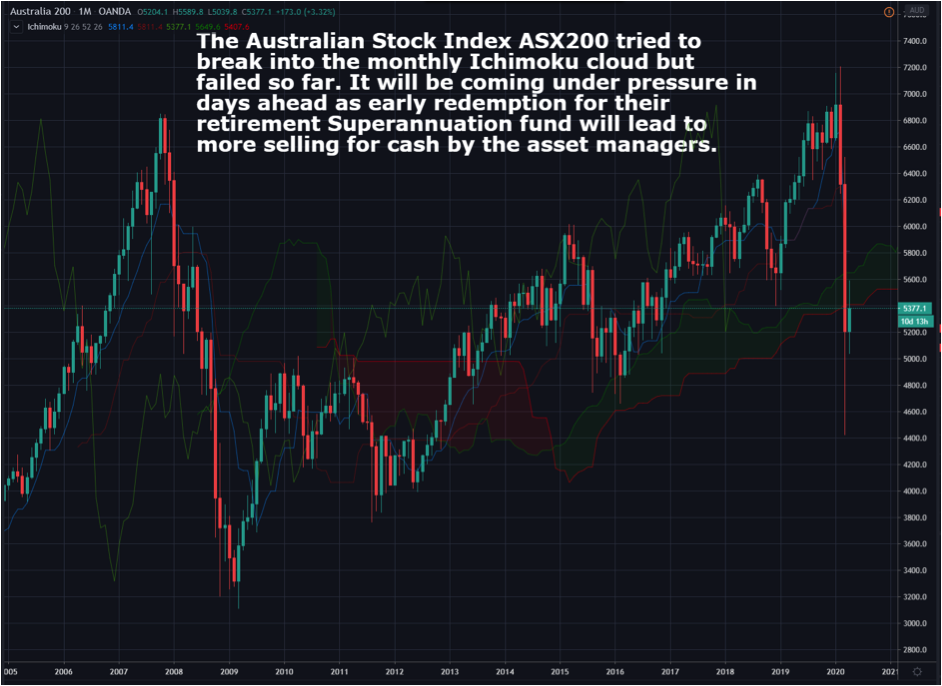
Source: tradingview.com
Vee, our Founder/CIO highlights patterns/formations on selected chart(s) every week which may have the potential to turn into trading opportunities. These charts are first sent out on Monday of the week to the TRACKRECORD COMMUNITY which helps them to filter out the noise and condense only what’s important in the markets for the week ahead.
Disclaimer: The views and opinions expressed in this material do not constitute a recommendation by TrackRecord Pte. Ltd. that any particular investment, security, transaction or investment strategy is suitable for any specific person. No part of this material may be reproduced or transmitted in any form or by any means, electronic, mechanical, photocopying, recording, or otherwise, without prior written permission of TrackRecord Pte. Ltd