10 Jan 2020: BAT

Disclaimer: The views and opinions expressed in this material do not constitute a recommendation by TrackRecord Pte Ltd or Gregg Tan and does not have regards to specific investment objectives, financial situation and/or the particular needs of any specific person. The main objective of this material is for educational and discussion purposes only. The technical views and commentaries are to facilitate the finer application of various technical tools.  These technical views may be subject to further revision without notice. No part of this material may be reproduced or transmitted in any form or by any means, electronic, mechanical, photocopying, recording, or otherwise, without prior written permission of TrackRecord Pte Ltd or Gregg Tan.

 Boundaries & Triggers (BAT): 10 Jan 2020 

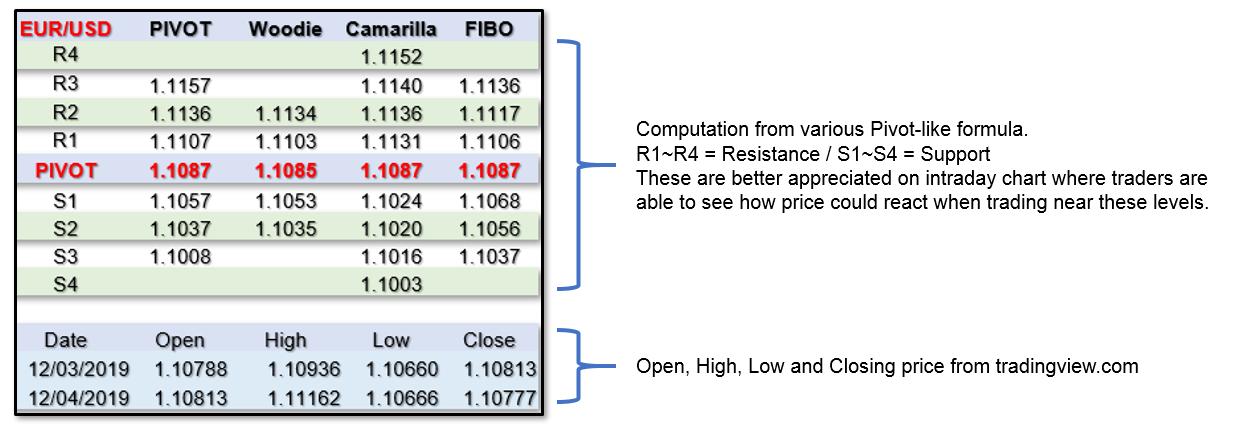
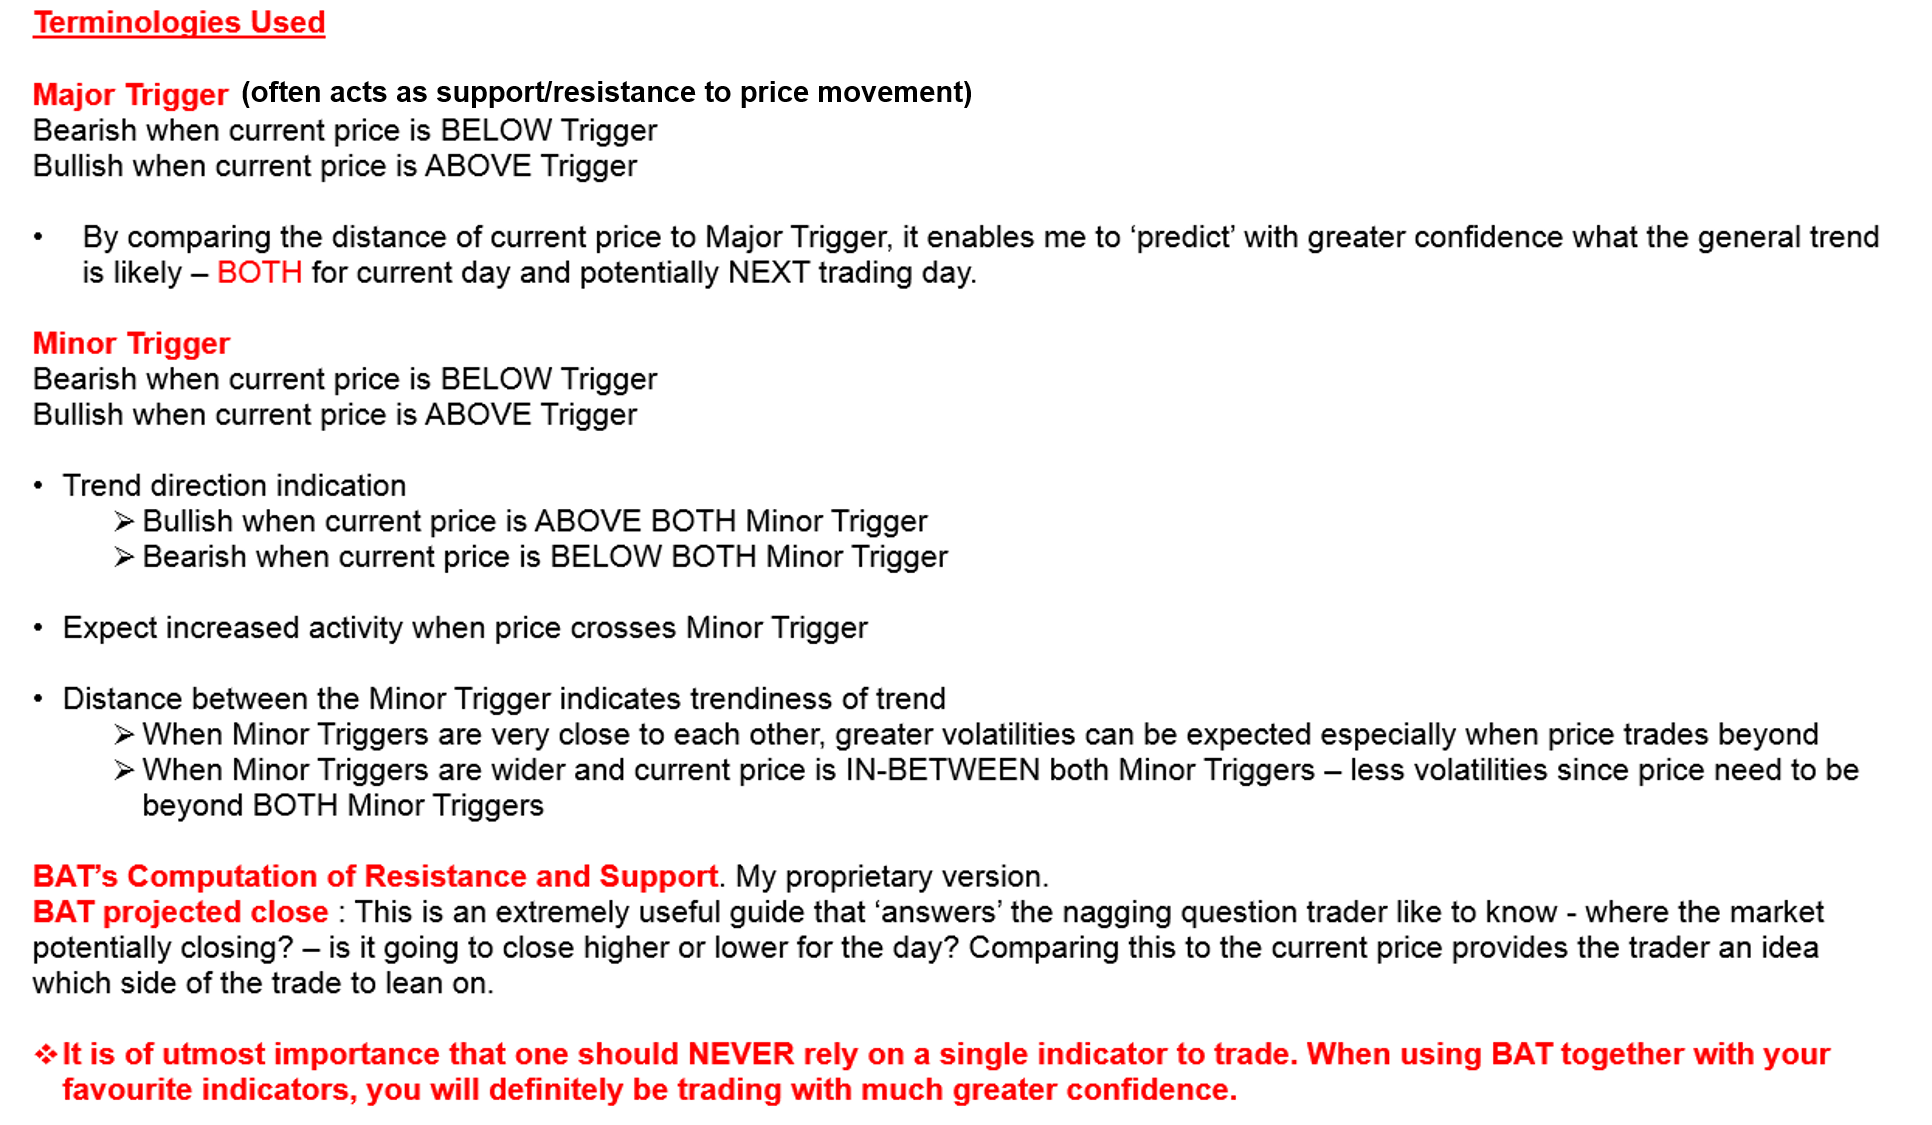
Daily Boundaries are actually a compilation of various Pivot Points-like mathematical calculation that are popular with intraday traders. The Boundaries (Support and Resistance) though may be very accurate – are generally used just as a guide in conjunction with other indicators. We feature our proprietary Boundaries And Trigger (BAT) in this report, which is a complex formula requiring the identification of unique price behaviour, price projections and BAT Triggers. The Triggers are levels that will likely attract immediate follow-through activities when price crosses it.

AUD/USD – 120 Mins (Click to view explanation on usage of BAT and Pivot Points)

EUR/USD – 120 Mins (Click to view explanation on usage of BAT and Pivot Points)

GBP/USD – 120 Mins (Click to view explanation on usage of BAT and Pivot Points)

USD/CHF – 120 Mins (Click to view explanation on usage of BAT and Pivot Points)

USD/JPY – 120 Mins (Click to view explanation on usage of BAT and Pivot Points)

USD/CAD – 120 Mins (Click to view explanation on usage of BAT and Pivot Points)


The charts above are compiled by Gregg. Gregg has over 38 years of experience in the finance industry. His responsibilities in the initial 20 years was mainly with major Financial institutions, spanning across roles as a Trader, Dealer and as Head of Fundamental/ Technical Research of a team in Indonesia. He then spent the next 18 years at Bloomberg as an Application Specialist for Charting and Technical Analysis. Many of Bloomberg’s Institutional clients have acknowledged that they found true value at Gregg’s sessions. Gregg was a key contributor to Bloomberg’s charting ecosystem, as evident when the development team even rescheduled a planned global summit just to accommodate his busy schedule. Gregg has recently joined TrackRecord’s team of professional analysts to value-add to our existing offerings.

2 Min Market Updates : 9th Jan 2020

CURRENCY MARKET WRAP

As of Thu 9 Jan, Singapore Time zone UTC+8

U.S. Dollar Index, +0.32%, 97.31
USDJPY, +0.55%, $109.04
EURUSD, -0.36%, $1.1113
GBPUSD, -0.15%, $1.3105
USDCAD, +0.24%, $1.3037
AUDUSD, +0.07%, $0.6876
NZDUSD, +0.18%, $0.6654

S&P 500 (+0.49%) set a new high on Wednesday, as investors were relieved to hear that the situation in Iran may not escalate militarily beyond the actions taken by Iran last night. Iran fired more than a dozen ballistic missiles against U.S. and coalition forces in Iraq, which immediately sent equity futures down more than 1.5%. The reaction was short-lived upon details that it resulted in no American casualties and Tehran said it did not seek escalation or war. Trump told the nation in a press conference that he will be imposing additional sanctions on Iran, implicating that economic countermeasures will be favored over military ones.

U.S. ADP Employment Change Report showed an estimated 202,000 positions were added to private sector payrolls in December (consensus 155,000) on top of an upwardly revised 124,000 (from 67,000) in November.

U.S. Treasuries declined alongside the advance in equities, driving yields higher across the curve. The 2-yr yield rose four basis points to 1.58%, and the 10-yr yield rose five basis points to 1.87%. The U.S. Dollar Index increased 0.32% to 97.31. Gold futures fell 0.9% to $1560.50/ozt.

STOCK MARKET WRAP 

S&P500, +0.49%, 3,253.05
Nasdaq, +0.67%, 9,129.24
Nikkei Futures, +0.22%, 23,532.5

The information technology (+1.0%) and communication services (+0.7%) sectors outperformed, while the energy sector (-1.7%) fell behind amid a retreat in oil prices ($59.62, -3.06, -4.9%). WTI crude futures dropped below $60/bbl following bearish inventory data and receding concerns about production disruptions.

Stock laggards included Boeing (BA 331.37, -5.91, -1.8%) after a 737-800 jetliner crashed shortly after takeoff in Tehran, killing all 176 passengers on board, and Walgreens Boots Alliance (WBA 55.83, -3.46, -5.8%) after it missed earnings estimates.

Positive corporate news came out of Macy’s (M 18.10, +0.43, +2.4%), which reported better than feared holiday sales, and Constellation Brands (STZ 190.29, +6.69, +3.6%), which beat top and bottom-line estimates.


8 Jan 2020: BAT, A Technician’s Perspective

Disclaimer: The views and opinions expressed in this material do not constitute a recommendation by TrackRecord Pte Ltd or Gregg Tan and does not have regards to specific investment objectives, financial situation and/or the particular needs of any specific person. The main objective of this material is for educational and discussion purposes only. The technical views and commentaries are to facilitate the finer application of various technical tools.  These technical views may be subject to further revision without notice. No part of this material may be reproduced or transmitted in any form or by any means, electronic, mechanical, photocopying, recording, or otherwise, without prior written permission of TrackRecord Pte Ltd or Gregg Tan.


 Boundaries & Triggers (BAT): 8 Jan 2020 

Daily Boundaries are actually a compilation of various Pivot Points like mathematical calculation that are popular with intraday traders. The Boundaries (Support and Resistance) though may be very accurate – are generally used just as a guide in conjunction with other indicators. The featured Pivots are – Standard Pivot Point, Woodies Pivot, Camarilla Pivot and Fibonacci Pivot. We are also featuring our proprietary Boundaries And Trigger (BAT). This is a complex formula requiring the identification of unique price behaviour, price projections and BAT Triggers. The Triggers are levels that will likely attract immediate follow-through activities when price crosses it.

AUD/USD – 120 Mins (Click to view explanation on usage of BAT and Pivot Points)

EUR/USD – 120 Mins (Click to view explanation on usage of BAT and Pivot Points)

GBP/USD – 120 Mins (Click to view explanation on usage of BAT and Pivot Points)

USD/CHF – 120 Mins (Click to view explanation on usage of BAT and Pivot Points)

USD/JPY – 120 Mins (Click to view explanation on usage of BAT and Pivot Points)

USD/CAD – 120 Mins (Click to view explanation on usage of BAT and Pivot Points)

A Technician’s Perspective: 8 Jan 2020 

USD/CAD – DAILY


The charts above are compiled by Gregg. Gregg has over 38 years of experience in the finance industry. His responsibilities in the initial 20 years was mainly with major Financial institutions, spanning across roles as a Trader, Dealer and as Head of Fundamental/ Technical Research of a team in Indonesia. He then spent the next 18 years at Bloomberg as an Application Specialist for Charting and Technical Analysis. Many of Bloomberg’s Institutional clients have acknowledged that they found true value at Gregg’s sessions. Gregg was a key contributor to Bloomberg’s charting ecosystem, as evident when the development team even rescheduled a planned global summit just to accommodate his busy schedule. Gregg has recently joined TrackRecord’s team of professional analysts to value-add to our existing offerings.

2 Min Market Summary : 8th Jan 2020

CURRENCY MARKET WRAP 

As of Wed 8 Jan, Singapore Time zone UTC+8

U.S. Dollar Index, +0.32%, 96.98
USDJPY, +0.09%, $108.47
EURUSD, -0.41%, $1.1149
GBPUSD, -0.40%, $1.3117
USDCAD, +0.29%, $1.3002
AUDUSD, -1.02%, $0.6870
NZDUSD, -0.46%, $0.6642

U.S. ISM Non-Manufacturing Index for December registered a 55.0% reading (consensus 54.3%), up from 53.9% in November and the fastest pace since August 2019. Factory Orders declined 0.7% m/m in November (consensus -0.8%) following a downwardly revised 0.2% increase (from 0.3%) in October. Shipments were up 0.3% following a 0.1% increase in October. The trade deficit narrowed to $43.1 billion in November (consensus -$43.5 billion) from an upwardly revised $46.9 billion (from -$47.2 bln) in October.

Iran stepped up its retaliatory threats against the U.S., but the lack of follow-through reassured investors that the situation currently presents little threat to the U.S. economy. Similarly, a pullback in oil prices ($62.68/bbl, -0.58, -0.9%) reflected skepticism that the situation would meaningfully disrupt production.

U.S. Treasuries finished the tight-ranged session little changed. The 2-yr yield remained at 1.54%, the 10-yr yield increased two basis points to 1.83%. The U.S. Dollar Index increased 0.32% to 96.98.

STOCK MARKET WRAP 

S&P500, -0.28%, 3,237.18
Nasdaq, -0.03%, 9,068.58
Nikkei Futures, +0.97%, 23,325.0

Within the stock market, all 11 S&P 500 sectors still finished lower in a lackluster session. The real estate sector (-1.2%) was today’s weakest performer, followed by the consumer staples (-0.7%) and financials (-0.7%) sectors. A fade into the close pushed the communication services (-0.04%), information technology (-0.1%), and industrials (-0.1%) sectors into negative territory.

Semiconductor stocks were among today’s strongest performers after Microchip (MCHP 110.69, +6.96, +6.7%) raised its Q3 revenue guidance and Micron (MU 58.27, +4.71, +8.8%) was upgraded to Outperform from Market Perform at Cowen. The Philadelphia Semiconductor Index rose 1.8%.

Other notable gainers included Apache (APA 32.51, +6.87, +26.8%) after it announced a significant oil discovery off the shore of Suriname and Tesla (TSLA 469.06, +17.52, +3.9%) after it officially opened its Gigafactory 3 in Shanghai.


BAT review: 6 Jan 2020

Here’s how your trades would have panned out with reference to the BAT trigger levels as pointed out in yesterday’s TA report


AUD/USD: No Levels Are Triggered


EUR/USD: Price traded higher, upon crossing Major Trigger (Level 1.11833)


GBP/USD: Price traded higher, upon crossing Minor Trigger (Level 1.31072)


USD/CHF: Price traded lower, upon crossing Major Trigger (Level 0.96983)


USD/JPY: Price traded higher, upon crossing Major Trigger (Level 108.077)


USD/CAD: Price traded lower, upon crossing Minor Trigger (Level 1.29794)

7 Jan 2020: BAT

Disclaimer: The views and opinions expressed in this material do not constitute a recommendation by TrackRecord Pte Ltd or Gregg Tan and does not have regards to specific investment objectives, financial situation and/or the particular needs of any specific person. The main objective of this material is for educational and discussion purposes only. The technical views and commentaries are to facilitate the finer application of various technical tools.  These technical views may be subject to further revision without notice. No part of this material may be reproduced or transmitted in any form or by any means, electronic, mechanical, photocopying, recording, or otherwise, without prior written permission of TrackRecord Pte Ltd or Gregg Tan.


 Boundaries & Triggers (BAT): 7 Jan 2020 

Daily Boundaries are actually a compilation of various Pivot Points like mathematical calculation that are popular with intraday traders. The Boundaries (Support and Resistance) though may be very accurate – are generally used just as a guide in conjunction with other indicators. The featured Pivots are – Standard Pivot Point, Woodies Pivot, Camarilla Pivot and Fibonacci Pivot. We are also featuring our proprietary Boundaries And Trigger (BAT). This is a complex formula requiring the identification of unique price behaviour, price projections and BAT Triggers. The Triggers are levels that will likely attract immediate follow-through activities when price crosses it.

AUD/USD – 120 Mins (Click to view explanation on usage of BAT and Pivot Points)

EUR/USD – 120 Mins (Click to view explanation on usage of BAT and Pivot Points)

GBP/USD – 120 Mins (Click to view explanation on usage of BAT and Pivot Points)

USD/CHF – 120 Mins (Click to view explanation on usage of BAT and Pivot Points)

USD/JPY – 120 Mins (Click to view explanation on usage of BAT and Pivot Points)

USD/CAD – 120 Mins (Click to view explanation on usage of BAT and Pivot Points)


The charts above are compiled by Gregg. Gregg has over 38 years of experience in the finance industry. His responsibilities in the initial 20 years was mainly with major Financial institutions, spanning across roles as a Trader, Dealer and as Head of Fundamental/ Technical Research of a team in Indonesia. He then spent the next 18 years at Bloomberg as an Application Specialist for Charting and Technical Analysis. Many of Bloomberg’s Institutional clients have acknowledged that they found true value at Gregg’s sessions. Gregg was a key contributor to Bloomberg’s charting ecosystem, as evident when the development team even rescheduled a planned global summit just to accommodate his busy schedule. Gregg has recently joined TrackRecord’s team of professional analysts to value-add to our existing offerings.

2 Min Market Summary : 7th Jan 2020

CURRENCY MARKET WRAP 

As of Tue 7 Jan, Singapore Time zone UTC+8

U.S. Dollar Index, -0.25%, 96.62
USDJPY, +0.41%, $108.42
EURUSD, +0.30%, $1.1195
GBPUSD, +0.72%, $1.3171
USDCAD, -0.21%, $1.2962
AUDUSD, -0.09%, $0.6938
NZDUSD, +0.21%, $0.6668

Rhetoric heated up between the U.S. and Iran over the weekend following Friday’s deadly airstrike, but investors viewed the current geopolitical angst as mostly inconsequential for the economy and the earnings prospects of U.S. companies. Supporting this view was the rebound in stocks, the fade in oil prices ($63.26, +0.23, +0.4%), and the sharp reversal in the CBOE Volatility Index (13.89, -0.13, -0.9%).

U.S. Treasuries finished the session on a lower note, as investors bought the dip in equities. The 2-yr yield increased three basis points to 1.54%, and the 10-yr yield increased two basis points to 1.81%. The U.S. Dollar Index declined 0.25% to 96.62.

STOCK MARKET WRAP 

S&P500, +0.35%, 3,246.28
Nasdaq, +0.56%, 9,071.47
Nikkei Futures, +0.14%, 23,287.5

The S&P 500 communication services sector (+1.2%) was today’s sector leader, largely due to the 2.5% gain in shares of Alphabet (GOOG 1394.21, +33.55) after the stock was upgraded to Buy from Hold at Pivotal Research Group.

Fellow tech giants Facebook (FB 212.60, +3.93, +1.9%), Amazon (AMZN 1902.88, +27.91, +1.5%), and Apple (AAPL 299.80, +2.37, +0.8%) also provided influential support for the broader market.

Conversely, the S&P 500 materials (-0.5%), financials (-0.1%), and industrials (-0.03%) sectors finished with modest losses, while the Philadelphia Semiconductor Index (-1.0%) succumbed to some profit-taking interest.

Separately, shares of Salesforce (CRM 173.45, +7.28, +4.4%) hit a new all-time high after the stock was upgraded to Top Pick from Outperform at RBC Capital Mkts. Shares of CrowdStrike (CRWD 55.11, +4.36, +8.6%) climbed nearly 9% as part of a cyber-security play against possible hacking threats from Iran.


6 Jan 2020: BAT, HIM, A Technician’s Perspective

Disclaimer: The views and opinions expressed in this material do not constitute a recommendation by TrackRecord Pte Ltd or Gregg Tan and does not have regards to specific investment objectives, financial situation and/or the particular needs of any specific person. The main objective of this material is for educational and discussion purposes only. The technical views and commentaries are to facilitate the finer application of various technical tools.  These technical views may be subject to further revision without notice. No part of this material may be reproduced or transmitted in any form or by any means, electronic, mechanical, photocopying, recording, or otherwise, without prior written permission of TrackRecord Pte Ltd or Gregg Tan.

 Historical Identical Movements (HIM): 3 Jan 2020 

Humans are creatures of habit and oftentimes react in a similar way to identical financial events or price swings. These emotional reactions are reflected in price activities which can be visualised on a chart. The Historical Identical Movements (HIM) displayed below reveals an almost identical movement in its past, if HIM were to repeat, it can be used as a visual guide for movements ahead. Be forewarned that I rely on various charting techniques and technical tools for my actual market analysis. All analysis only attempts to forecast the likely movement ahead, HIM provides an ‘insight’ into how price could unfold ahead of time.

Do note that HIM employs a totally different approach from “A Technician’s Perspective” report. HIM’s sole purpose is to locate Historical Identical Movements that are almost identical to current price setup. Should projected path in HIM (movement after the light blue demarcation) align with “A Technician’s Perspective” report – it is at best a visual guide to how price could unfold.


 Boundaries & Triggers (BAT): 6 Jan 2020 

Daily Boundaries are actually a compilation of various Pivot Points like mathematical calculation that are popular with intraday traders. The Boundaries (Support and Resistance) though may be very accurate – are generally used just as a guide in conjunction with other indicators. The featured Pivots are – Standard Pivot Point, Woodies Pivot, Camarilla Pivot and Fibonacci Pivot. We are also featuring our proprietary Boundaries And Trigger (BAT). This is a complex formula requiring the identification of unique price behaviour, price projections and BAT Triggers. The Triggers are levels that will likely attract immediate follow-through activities when price crosses it.

AUD/USD – 120 Mins (Click to view explanation on usage of BAT and Pivot Points)

EUR/USD – 120 Mins (Click to view explanation on usage of BAT and Pivot Points)

GBP/USD – 120 Mins (Click to view explanation on usage of BAT and Pivot Points)

USD/CHF – 120 Mins (Click to view explanation on usage of BAT and Pivot Points)

USD/JPY – 120 Mins (Click to view explanation on usage of BAT and Pivot Points)

USD/CAD – 120 Mins (Click to view explanation on usage of BAT and Pivot Points)

A Technician’s Perspective: 4 Jan 2020 

S&P 500 INDEX – WEEKLY

GOLD SPOT – WEEKLY

USD/JPY – WEEKLY

The charts above are compiled by Gregg. Gregg has over 38 years of experience in the finance industry. His responsibilities in the initial 20 years was mainly with major Financial institutions, spanning across roles as a Trader, Dealer and as Head of Fundamental/ Technical Research of a team in Indonesia. He then spent the next 18 years at Bloomberg as an Application Specialist for Charting and Technical Analysis. Many of Bloomberg’s Institutional clients have acknowledged that they found true value at Gregg’s sessions. Gregg was a key contributor to Bloomberg’s charting ecosystem, as evident when the development team even rescheduled a planned global summit just to accommodate his busy schedule. Gregg has recently joined TrackRecord’s team of professional analysts to value-add to our existing offerings.