
Disclaimer: The views and opinions expressed in this material do not constitute a recommendation by TrackRecord Pte Ltd or Gregg Tan and does not have regards to specific investment objectives, financial situation and/or the particular needs of any specific person. The main objective of this material is for educational and discussion purposes only. The technical views and commentaries are to facilitate the finer application of various technical tools. These technical views may be subject to further revision without notice. No part of this material may be reproduced or transmitted in any form or by any means, electronic, mechanical, photocopying, recording, or otherwise, without prior written permission of TrackRecord Pte Ltd or Gregg Tan.
Boundaries & Triggers (BAT): 17 Dec 2019
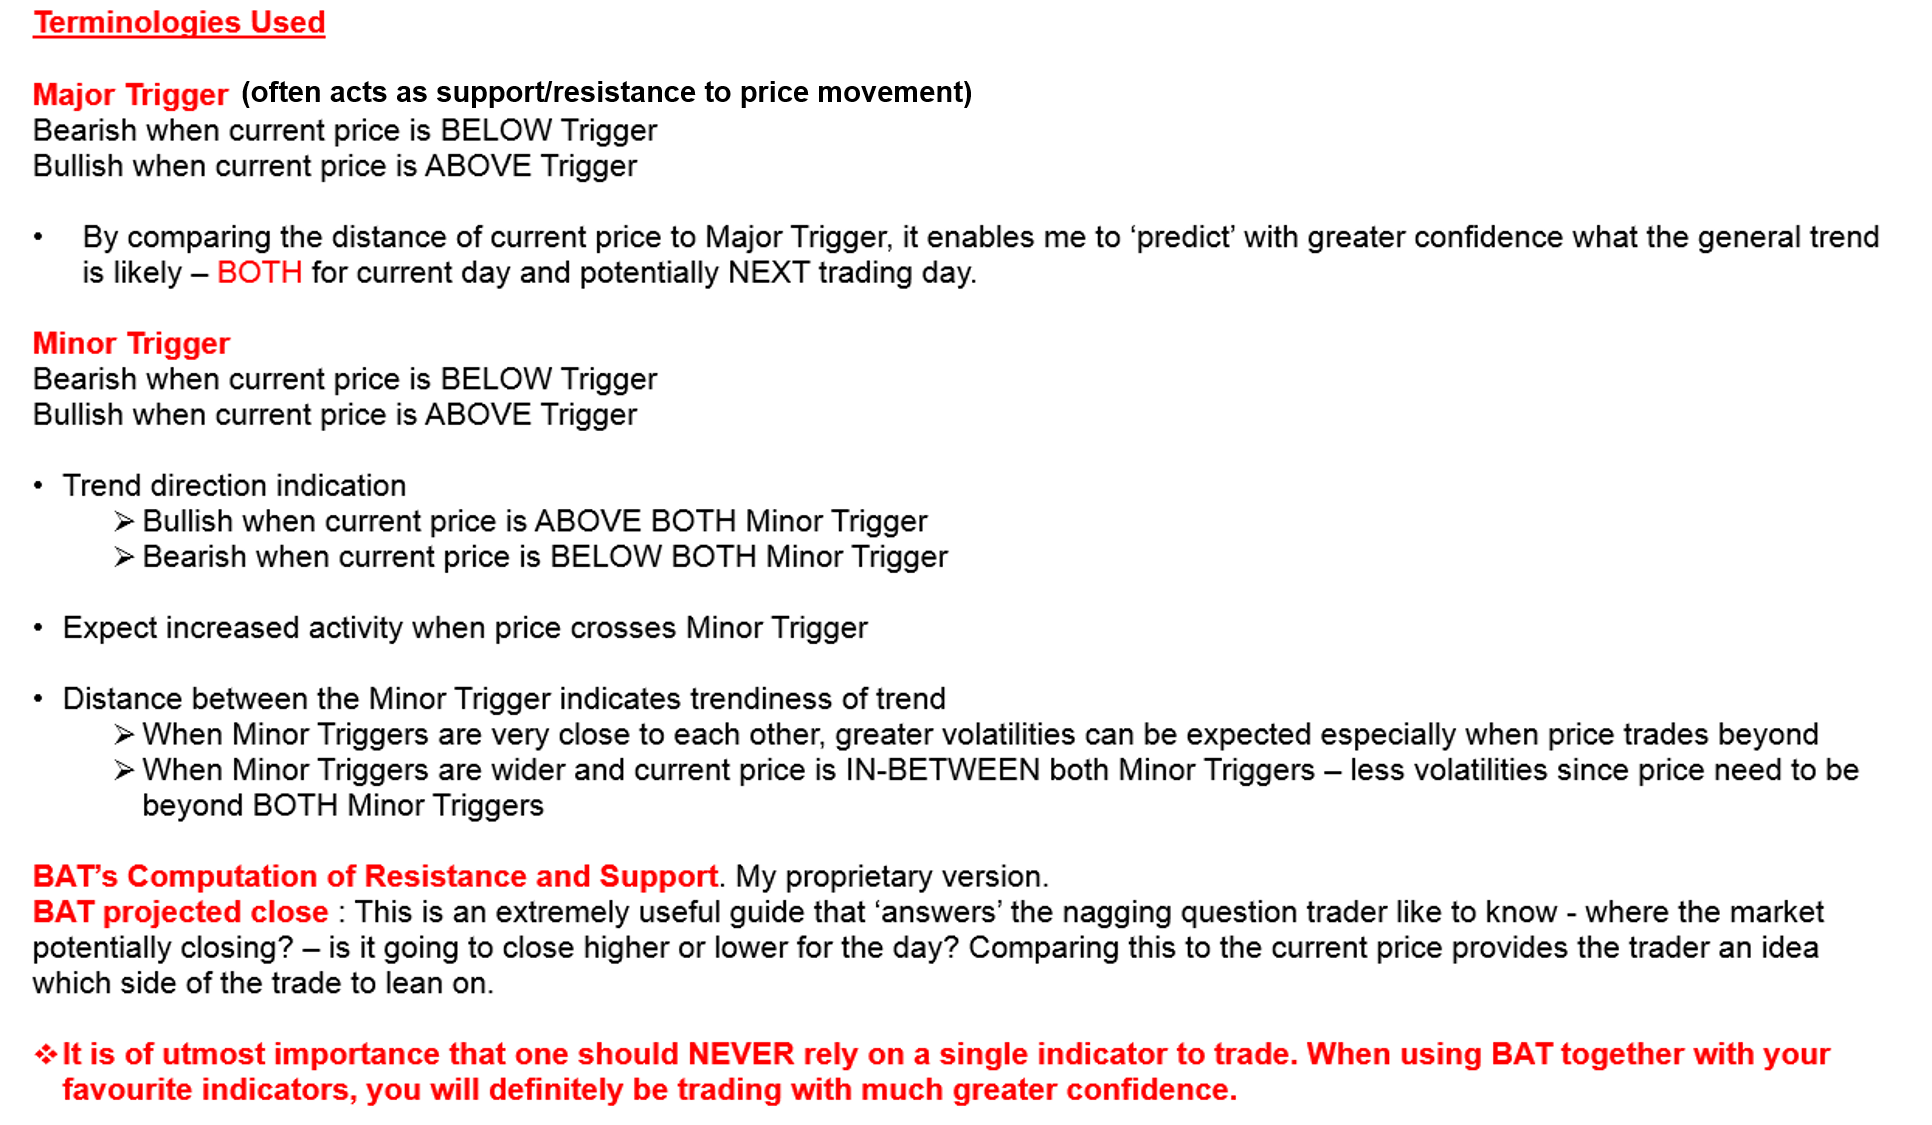
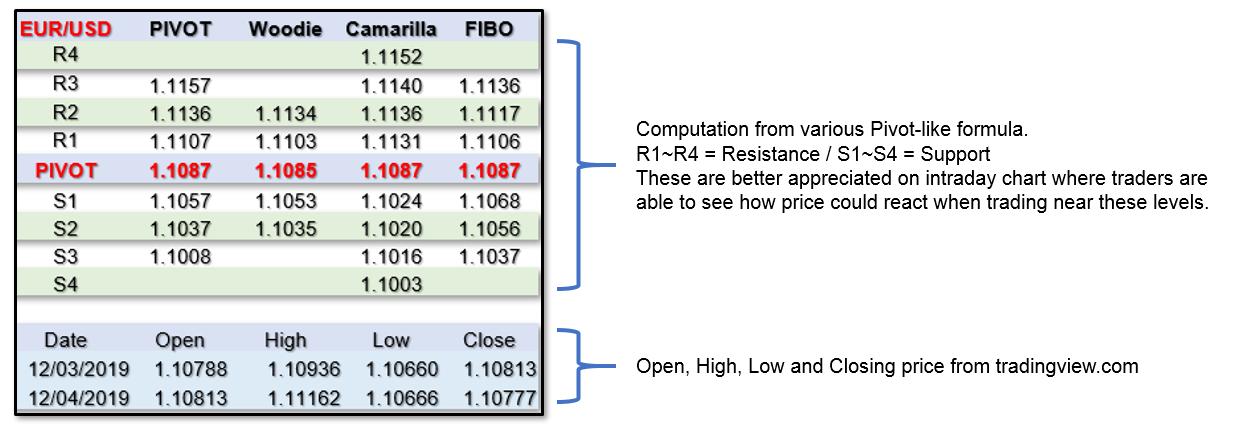
Daily Boundaries are actually a compilation of various Pivot Points like mathematical calculation that are popular with intraday traders. The Boundaries (Support and Resistance) though may be very accurate – are generally used just as a guide in conjunction with other indicators. The featured Pivots are – Standard Pivot Point, Woodies Pivot, Camarilla Pivot and Fibonacci Pivot. We are also featuring our proprietary Boundaries And Trigger (BAT). This is a complex formula requiring the identification of unique price behaviour, price projections and BAT Triggers. The Triggers are levels that will likely attract immediate follow-through activities when price crosses it.
AUD/USD – 120 Mins (Click to view explanation on usage of BAT and Pivot Points)

EUR/USD – 120 Mins (Click to view explanation on usage of BAT and Pivot Points)

GBP/USD – 120 Mins (Click to view explanation on usage of BAT and Pivot Points)

USD/CHF – 120 Mins (Click to view explanation on usage of BAT and Pivot Points)

USD/JPY – 120 Mins (Click to view explanation on usage of BAT and Pivot Points)

USD/CAD – 120 Mins (Click to view explanation on usage of BAT and Pivot Points)

A Technician’s Perspective: 17 Dec 2019


