
THE LONG & SHORT OF IT TRADERS’ RISK CALL: 16 Jan 2020 This week, Vee shares his thoughts on the following: 1. Markets recovered strongly after geopolitcal tensions with Iran to make all time highs. Why are bids relatively strong despite elevated tensions? 2. With trade deal signed and existing tariffs remaining status quo, what […]
CURRENCY MARKET WRAP
As of Thu 16 Jan, Singapore Time zone UTC+8
U.S. Dollar Index, -0.17%, 97.21
USDJPY, +0.08%, $109.89
EURUSD, +0.20%, $1.1150
GBPUSD, +0.18%, $1.3041
USDCAD, -0.15%, $1.3043
AUDUSD, +0.04%, $0.6904
NZDUSD, +0.02%, $0.6617
U.S. PPI for final demand increased 0.1% (consensus +0.2%) and so did the PPI for final demand, excluding food and energy (consensus +0.2%). Those changes left the yr/yr increases at 1.3% and 1.1%, respectively, versus 1.1% and 1.3% in November. The Empire State Manufacturing Survey for January increased to 4.8 (consensus 2.8) from the prior month’s reading of 3.5.
U.S. and China signed Phase One of Trade Deal. The pause in the trade war gives Trump something concrete to offer farmers, a crucial element of his Midwestern firewall, heading into the 2020 election. Under the agreement, China has promised to buy an additional $12.5 billion in US agricultural products in year one, and then $19.5 billion in year two. Those commitments come atop roughly $24 billion in farm purchases that China made in 2017, before the trade war started. In exchange, the United States agreed to reduce tariffs on $120 billion in Chinese products from 15% to 7.5%. The lack of new details wasn’t supportive for further risk appetite, as the news was mostly priced in.
U.S. Treasuries ended the session on a higher note as part of a defensive-oriented trade. The 2-yr yield and the 10-yr yield declined three basis points each to 1.55% and 1.79%, respectively. The U.S. Dollar Index declined 0.2% to 97.21. WTI crude declined 0.8%, or $0.44, to $57.86/bbl.
STOCK MARKET WRAP
S&P500, +0.19%, 3,289.30
Nasdaq, +0.08%, 9,258.70
Nikkei Futures, +0.18%, 23,957.5
The defensive-oriented S&P 500 utilities (+1.4%), health care (+0.9%), real estate (+0.8%), and consumer staples (+0.7%) sectors were the best-performing sectors. Conversely, the energy (-0.7%), financials (-0.6%), and consumer discretionary (-0.3%) sectors finished in the red.
The financials sector was pressured by a modest decline in Treasury yields and by the negative reactions to earnings results from Bank of America (BAC 34.67, -0.65, -1.8%), U.S. Bancorp (USB 54.97, -1.62, -2.9%), and Goldman Sachs (GS 245.21, -0.45, -0.2%). BlackRock (BLK 530.26, +11.94, +2.3%) pleased investors with its results.
Target (TGT 117.00, -8.26, -6.6%) reported relatively disappointing holiday sales results due to softer-than-expected performance in categories such as electronics, toys, and portions of its home businesses.
The Philadelphia Semiconductor Index fell 1.2% amid some profit-taking interest, with shares of Taiwan Semi (TSM 58.39, -1.93, -3.2%) pulling back from record territory in front of its earnings report tomorrow morning.
CURRENCY MARKET WRAP
As of Wed 15 Jan, Singapore Time zone UTC+8
U.S. Dollar Index, +0.05%, 97.39
USDJPY, -0.08%, $109.85
EURUSD, -0.06%, $1.1128
GBPUSD, +0.24%, $1.3022
USDCAD, +0.09%, $1.3068
AUDUSD, -0.12%, $0.6895
NZDUSD, -0.36%, $0.6607
U.S. CPI for December brought good news in relative terms, as there weren’t any overshoots compared to expectations. Total CPI was up 0.2% m/m, as expected, while core CPI, which excludes food and energy, was up a softer-than-expected 0.1% (consensus +0.2%). Core CPI has been up 2.3% yr/yr for three straight months, so the inflation rate isn’t running away from the Fed, which seems to have adopted a willingness to let inflation run above its longer-run goal for a bit before moving on rates; moreover, the CPI data takes a backseat to the PCE price data as the Fed’s preferred inflation gauge, and the latest report showed core-PCE inflation up just 1.6% yr/yr.
In Washington, Lawyers for Michael Flynn, Trump’s former national security adviser, on Tuesday said in a court filing that he would seek to withdraw his guilty plea in former Special Counsel Robert Mueller’s investigation. Flynn pleaded guilty in late 2017 to lying to the FBI about interactions with Russia’s ambassador to the United States in the weeks before Trump took office but has since argued that his rights were violated.
U.S. Treasuries finished the quiet session on a mostly higher note. The 2-yr yield was unchanged at 1.58%, and the 10-yr yield declined three basis points to 1.82%. The U.S. Dollar Index finished flat at 97.39. WTI crude increased 0.3%, or $0.18, to $58.30/bbl.
STOCK MARKET WRAP
S&P500, -0.15%, 3,283.15
Nasdaq, -0.24%, 9,251.33
Nikkei Futures, -0.24%, 23,897.5
The day began with JPMorgan Chase (JPM 138.80, +1.60, +1.2%), Citigroup (C 81.91, +1.26, +1.6%), and Delta Air Lines (DAL 61.45, +1.96, +3.3%) providing investors with better-than-expected earnings results, while Wells Fargo (WFC 49.32, -2.79, -5.4%) missed top and bottom-line estimates due to higher expenses.
The results contributed to noticeable price changes in the stocks, but the price action in the broader market was relatively tight-ranged amid some buyer exhaustion. At its high, the S&P 500 was up just 0.2%, and it was down just 0.3% after Bloomberg reported that existing tariffs on Chinese imports will remain for at least ten months.
From a sector standpoint, the S&P 500 information technology (-0.6%) and real estate (-0.5%) sectors were laggards, while the health care (+0.5%) and utilities (+0.3%) sectors finished with modest gains. Apple (AAPL 312.68, -4.28, -1.4%) weighed on the tech sector after shares were downgraded to Underweight from Neutral at Atlantic Equities.
In other corporate news, Boston Scientific (BSX 42.66, -2.81, -6.2%) issued downside revenue guidance. A recent study indicated that Walt Disney’s (DIS 145.20, +1.32, +0.9%) streaming app may have been downloaded more than 40 million times. Visa (V 196.05, +0.72, +0.4%) agreed to acquire Plaid for $5.3 billion.
CURRENCY MARKET WRAP
As of Tue 14 Jan, Singapore Time zone UTC+8
U.S. Dollar Index, +0.02%, 97.38
USDJPY, +0.42%, $110.01
EURUSD, +0.16%, $1.1135
GBPUSD, -0.44%, $1.2987
USDCAD, -0.08%, $1.3056
AUDUSD, -0.04%, $0.6898
NZDUSD, -0.18%, $0.6625
Monday’s economic data was limited to the Treasury Budget for December, which showed a deficit of $13.3 billion (consensus -$15.0 billion) versus a deficit of $13.5 billion in the same period a year ago. The budget deficit over the last 12 months is $1.022 trillion versus $1.022 trillion in November.
Yesterday’s good risk appetite could be attributed to several factors: 1) the positive price action buoying sentiment, 2) expectations that the upcoming earnings season will include reassuring guidance, 3) news the U.S. will remove China from its currency manipulator list, thereby improving trade relations and possibly economic growth prospects, and 4) little negative news to derail sentiment.
U.S. Treasury Department on Monday dropped its designation of China as a currency manipulator days before top officials were due to sign a preliminary trade agreement. In its latest currency report, the Treasury said that as part of the Phase 1 trade deal, China had made “enforceable commitments to refrain from competitive devaluation” and agreed to publish relevant data on exchange rates and external balances.
U.S. Treasuries finished slightly lower in a tight-ranged session. The 2-yr yield and the 10-yr yield increased two basis points each to 1.58% and 1.85%, respectively. The U.S. Dollar Index finished flat at 97.38. WTI crude fell 1.5%, or $0.87, to $58.12/bbl.
STOCK MARKET WRAP
S&P500, +0.70%, 3,288.13
Nasdaq, +1.04%, 9,273.93
Nikkei Futures, +1.01%, 23,955.0
Ten of the 11 S&P 500 sectors pushed higher, with leadership coming from the materials (+1.4%), information technology (+1.3%), and real estate (+1.2%) sectors. Apple (AAPL 316.96, +6.63, +2.1%) remained an influential force after its price target was raised to $375 from $300 at D.A. Davidson.
High-growth stocks remained in favor, too, particularly Tesla (TSLA 524.86, +46.71, +9.8%), lululemon athletica (LULU 245.18, +10.34, +4.4%), and Beyond Meat (BYND 114.34, +18.27, +19.0%). Tesla had its price target raised to $612 from $385 at Oppenheimer. Lululemon raised its Q4 EPS, revenue, and comparable sales guidance.
The health care sector (-0.4%) was the lone holdout amid disappointing guidance from Abiomed (ABMD 168.10, -20.96, -11.1%), weakness in the insurance stocks after Senator Bernie Sanders (I-VT) took the lead in the latest poll in Iowa, and a relatively quiet first day at the JPMorgan Healthcare Conference.
Disclaimer: The views and opinions expressed in this material do not constitute a recommendation by TrackRecord Pte Ltd or Gregg Tan and does not have regards to specific investment objectives, financial situation and/or the particular needs of any specific person. The main objective of this material is for educational and discussion purposes only. The technical views and commentaries are to facilitate the finer application of various technical tools. These technical views may be subject to further revision without notice. No part of this material may be reproduced or transmitted in any form or by any means, electronic, mechanical, photocopying, recording, or otherwise, without prior written permission of TrackRecord Pte Ltd or Gregg Tan.
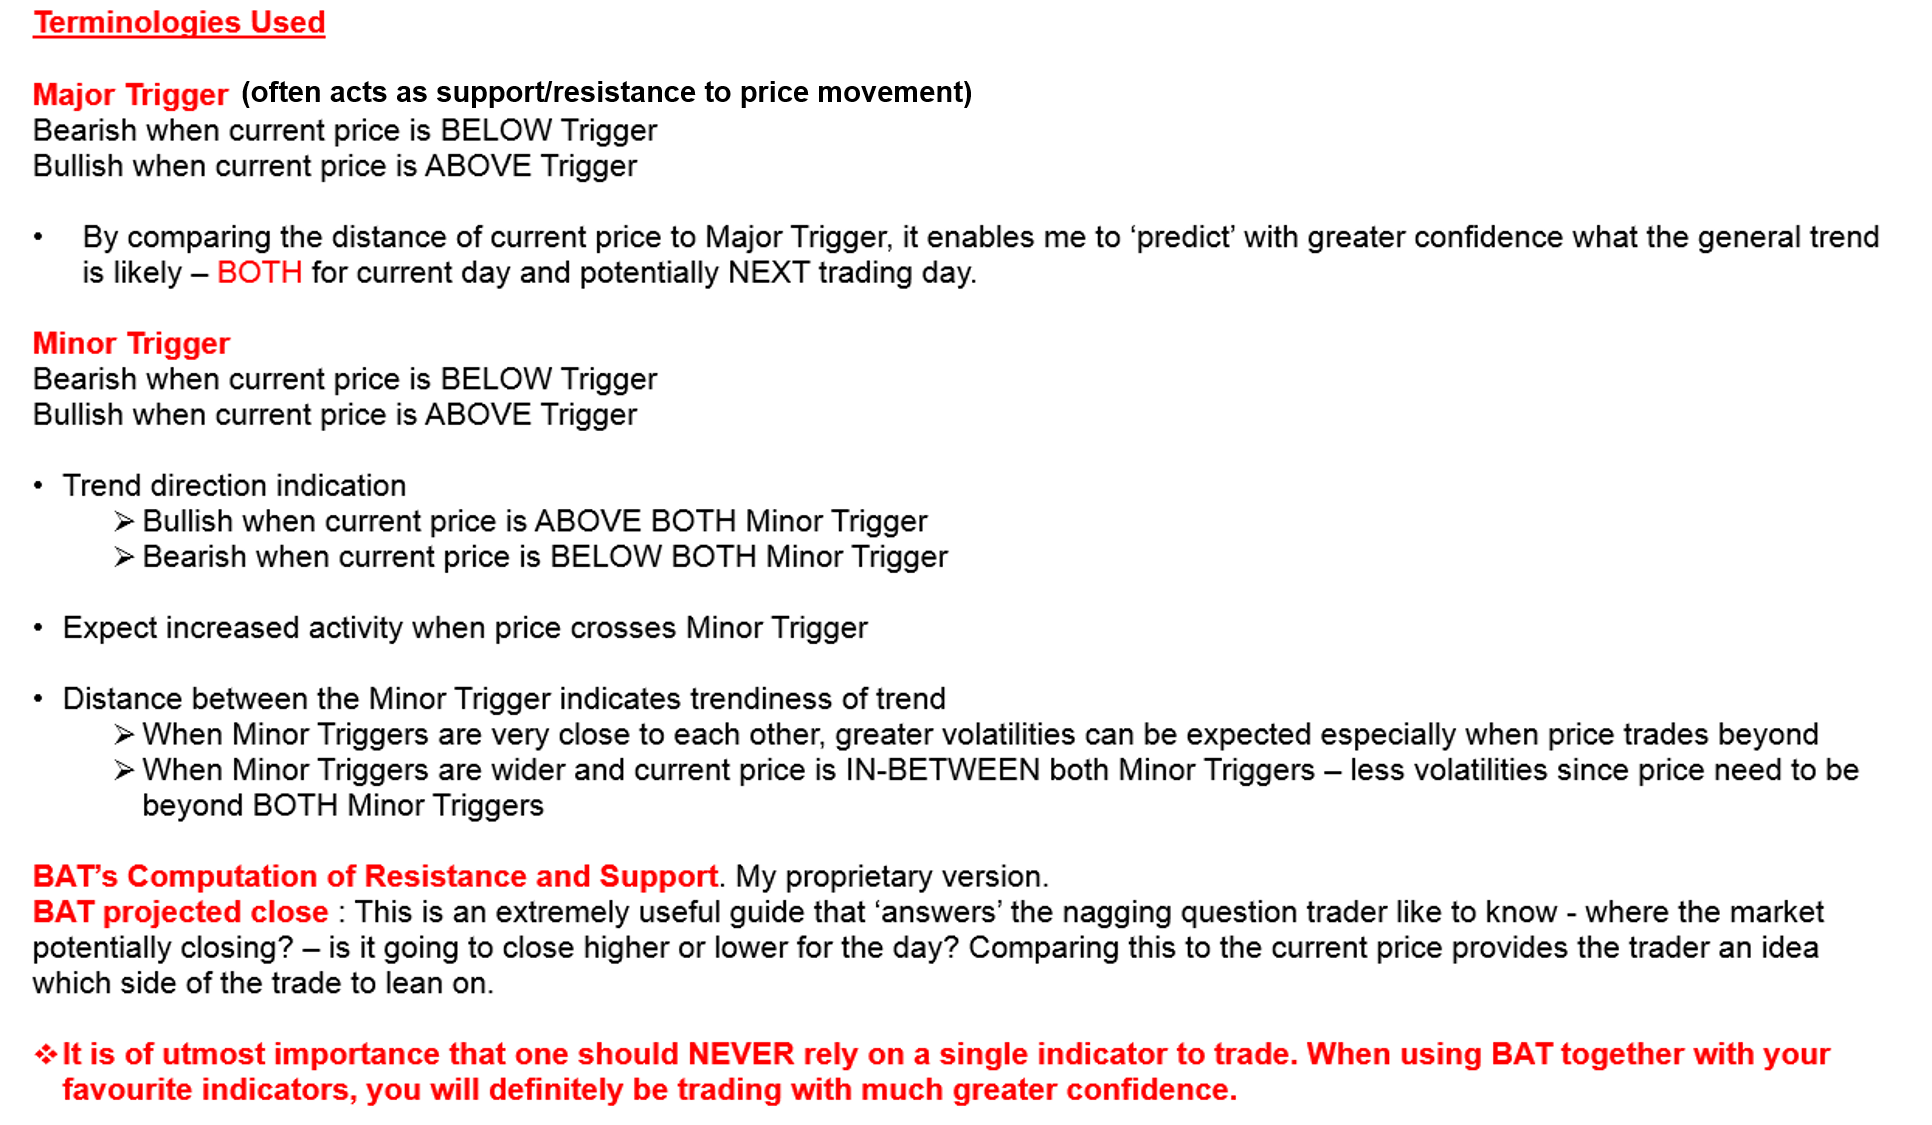
Boundaries & Triggers (BAT): 14 Jan 2020
Daily Boundaries are actually a compilation of various Pivot Points like mathematical calculation that are popular with intraday traders. The Boundaries (Support and Resistance) though may be very accurate – are generally used just as a guide in conjunction with other indicators. The featured Pivots are – Standard Pivot Point, Woodies Pivot, Camarilla Pivot and Fibonacci Pivot. We are also featuring our proprietary Boundaries And Trigger (BAT). This is a complex formula requiring the identification of unique price behaviour, price projections and BAT Triggers. The Triggers are levels that will likely attract immediate follow-through activities when price crosses it.
AUD/USD – 60 Mins (Click to view explanation on usage of BAT and Pivot Points)

EUR/USD – 60 Mins (Click to view explanation on usage of BAT and Pivot Points)

GBP/USD – 60 Mins (Click to view explanation on usage of BAT and Pivot Points)

USD/CHF – 60 Mins (Click to view explanation on usage of BAT and Pivot Points)

USD/JPY – 60 Mins (Click to view explanation on usage of BAT and Pivot Points)

USD/CAD – 60 Mins (Click to view explanation on usage of BAT and Pivot Points)

Boundaries & Triggers (BAT) REVIEW: 13 Jan 2020
Here’s how yesterday’s charts panned out based on the trigger levels identified.
AUDUSD Crossed Above Minor Trigger (0.69025), potential to trend upwards.

EURUSD Crossed Above Minor Trigger (1.11114), potential to trend upwards.

GBPUSD Crossed Below Major Trigger (1.29972), potential to trend lower.

USDCHF Crossed Below Minor Trigger (0.97340), potential to trend lower.

USDJPY Crossed Above Minor Trigger (109.540), potential to trend upwards.

USDCAD In Between Minor Triggers (1.30529 – 1.30638), potential breakout pending.

The charts above are compiled by Gregg. Gregg has over 38 years of experience in the finance industry. His responsibilities in the initial 20 years was mainly with major Financial institutions, spanning across roles as a Trader, Dealer and as Head of Fundamental/ Technical Research of a team in Indonesia. He then spent the next 18 years at Bloomberg as an Application Specialist for Charting and Technical Analysis. Many of Bloomberg’s Institutional clients have acknowledged that they found true value at Gregg’s sessions. Gregg was a key contributor to Bloomberg’s charting ecosystem, as evident when the development team even rescheduled a planned global summit just to accommodate his busy schedule. Gregg has recently joined TrackRecord’s team of professional analysts to value-add to our existing offerings.
What are they, why are they wrong, what should be done instead?
Hi, I’m Gregg Tan and I have over 38 years of experience in the finance industry spanning across roles as a trader, dealer and Head of Fundamental/Technical Research Team in Indonesia. Majority of my experience is in Bloomberg as a Technical Analysis Application Specialist where I leverage on my trading and analytical experience to benefit Bloomberg’s Institutional clients.
Through my years of experience, I have come across various mistakes made by users of Technical Analysis – some even made by experienced traders in institutions! I have filtered and condensed these common errors into the following “Top 5 Technical Analysis Mistakes” so that you can avoid making these same ones in your trading journey.
Mistake 1: They do not know the pricing field used when computing the indicators
I have seen numerous veteran traders who do not know what pricing field(s) are used to compute the indicators they are using. This is the single most important knowledge needed before using any indicators.
For example, when using RSI, a more reliable signal occurs when there is a divergence or convergence between indicator and price movement. Majority of users will be looking to
sell when a divergence occurs – when prices are making higher highs whereas the RSI reading is not. Most users are unaware and tend to compare the high of the price bar to the reading of the RSI for divergence, and the low of the price bar to the reading of RSI for convergence. This is wrong as the RSI computation only uses a closing price.
Did you know? The computation of Stochastics requires the high, low and close price of the underlying. By comparing Stochastics reading with the line chart, users are missing important information and worse, as the majority of charting platforms compute indicators based on the chart type utilised, in such instances, the Stochastics is computed using only the closing price.
Mistake 2: They do not understand their trading/investment horizon
When asked about their trading/investment horizon, most responses will likely be short-term, long-term or daily. Many fail to understand that the definition of the duration used greatly differs between different market players.
For example, Investments of a minimum of 12-months are considered short-term to Warren Buffet as the majority of his investments are for much longer periods. To an interbank dealer, holding positions over 1 to 2 hours could be considered as long-term. Likewise, day traders can be broken down to High-Frequency Traders (Scalpers), or traders gunning for 10 to 20 pips to a trader buying in the morning and squaring-off their position before end-of-day.
Only when armed with this knowledge, is one able to know how to configure their charts to their trading/investment horizon.
WANT THE FULL LIST OF THE “TOP 5 TECHNICAL ANALYSIS MISTAKES” MADE, EVEN BY PROFESSIONAL TRADERS?
FILL UP YOUR DETAILS BELOW, THEN CHECK YOUR EMAIL TO AVOID MAKING THESE SAME MISTAKES!
Disclaimer: The views and opinions expressed in this material do not constitute a recommendation by TrackRecord Pte Ltd or Gregg Tan and does not have regards to specific investment objectives, financial situation and/or the particular needs of any specific person. The main objective of this material is for educational and discussion purposes only. The technical views and commentaries are to facilitate the finer application of various technical tools. These technical views may be subject to further revision without notice. No part of this material may be reproduced or transmitted in any form or by any means, electronic, mechanical, photocopying, recording, or otherwise, without prior written permission of TrackRecord Pte Ltd or Gregg Tan.
Historical Identical Movements (HIM): 10 Jan 2020
Humans are creatures of habit and oftentimes react in a similar way to identical financial events or price swings. These emotional reactions are reflected in price activities which can be visualised on a chart. The Historical Identical Movements (HIM) displayed below reveals an almost identical movement in its past, if HIM were to repeat, it can be used as a visual guide for movements ahead. Be forewarned that I rely on various charting techniques and technical tools for my actual market analysis. All analysis only attempts to forecast the likely movement ahead, HIM provides an ‘insight’ into how price could unfold ahead of time.
Do note that HIM employs a totally different approach from “A Technician’s Perspective” report. HIM’s sole purpose is to locate Historical Identical Movements that are almost identical to current price setup. Should projected path in HIM (movement after the light blue demarcation) align with “A Technician’s Perspective” report – it is at best a visual guide to how price could unfold.


Boundaries & Triggers (BAT): 13 Jan 2020
Daily Boundaries are actually a compilation of various Pivot Points like mathematical calculation that are popular with intraday traders. The Boundaries (Support and Resistance) though may be very accurate – are generally used just as a guide in conjunction with other indicators. The featured Pivots are – Standard Pivot Point, Woodies Pivot, Camarilla Pivot and Fibonacci Pivot. We are also featuring our proprietary Boundaries And Trigger (BAT). This is a complex formula requiring the identification of unique price behaviour, price projections and BAT Triggers. The Triggers are levels that will likely attract immediate follow-through activities when price crosses it.
AUD/USD – 120 Mins (Click to view explanation on usage of BAT and Pivot Points)

EUR/USD – 120 Mins (Click to view explanation on usage of BAT and Pivot Points)

GBP/USD – 120 Mins (Click to view explanation on usage of BAT and Pivot Points)

USD/CHF – 120 Mins (Click to view explanation on usage of BAT and Pivot Points)

USD/JPY – 120 Mins (Click to view explanation on usage of BAT and Pivot Points)

USD/CAD – 120 Mins (Click to view explanation on usage of BAT and Pivot Points)

A Technician’s Perspective: 9 Jan 2020
USD/CAD – WEEKLY

The charts above are compiled by Gregg. Gregg has over 38 years of experience in the finance industry. His responsibilities in the initial 20 years was mainly with major Financial institutions, spanning across roles as a Trader, Dealer and as Head of Fundamental/ Technical Research of a team in Indonesia. He then spent the next 18 years at Bloomberg as an Application Specialist for Charting and Technical Analysis. Many of Bloomberg’s Institutional clients have acknowledged that they found true value at Gregg’s sessions. Gregg was a key contributor to Bloomberg’s charting ecosystem, as evident when the development team even rescheduled a planned global summit just to accommodate his busy schedule. Gregg has recently joined TrackRecord’s team of professional analysts to value-add to our existing offerings.
CURRENCY MARKET WRAP
As of Mon 13 Jan, Singapore Time zone UTC+8
U.S. Dollar Index, -0.09%, 97.36
USDJPY, -0.05%, $109.47
EURUSD, +0.14%, $1.1122
GBPUSD, -0.05%, $1.3061
USDCAD, -0.03%, $1.3052
AUDUSD, +0.66%, $0.6903
NZDUSD, +0.24%, $0.6631
December nonfarm payrolls increased by 145,000 (consensus 160,000), private sector payrolls increased by 139,000 (consensus 157,000), the unemployment rate was 3.5% (consensus 3.5%), and average hourly earnings were up 0.1% (consensus +0.3%). The key takeaway from the report, which included updates to the seasonal adjustment factors for the labor force series derived from the household survey, was that average hourly earnings and the average workweek were both weaker than expected. That may temper any inflation concerns, but at the same time it is apt to temper consumer spending activity and overall GDP growth expectations for the fourth quarter.
Wholesale inventories decreased 0.1% m/m in November (consensus +0.2%) after increasing 0.1% in October. Wholesale sales surged 1.5% after declining 0.9% in October.
U.S. Treasuries ended the session on a higher note as part of a defensive-oriented trade. The 2-yr yield declined one basis point to 1.56%, and the 10-yr yield declined three basis points to 1.83%. The U.S. Dollar Index declined 0.09% to 97.36. WTI crude fell 0.9%, or $0.55, to $58.99/bbl.
STOCK MARKET WRAP
S&P500, -0.29%, 3,265.35
Nasdaq, -0.27%, 9,178.86
Nikkei Futures, +0.42%, 23,800.0
Stock market hit new highs on Friday but succumbed to profit taking late in the session, as the December employment report failed to generate much excitement. In turn, the momentum that carried the market to record highs gradually transitioned to overdue selling, as cyclical sectors led the decline and selling picked up into the close. The S&P 500 financials (-0.8%), industrials (-0.7%), energy (-0.6%), and consumer discretionary (-0.5%) sectors were today’s laggards. The defensive-oriented real estate (+1.0%), utilities (+0.2%), and health care (+0.04%) sector finished higher.
Boeing (BA 329.92, -6.42, -1.9%) shares were pressured after disparaging employee memos about the 737 MAX situation were released. On a related, Boeing supplier Spirit Aerosystems (SPR 69.70, -3.09, -4.3%) said it will eliminate 2,800 jobs.
Six Flags (SIX 35.96, -7.80, -17.8%), KB Home (KBH 35.86, -1.20, -3.2%), and GrubHub (GRUB 52.38, -3.35, -6.0%) were other negative story stocks after providing disappointing updates. Six Flags issued downside Q4 guidance, KB Home missed revenue estimates, and GrubHub denied reports that it was seeking a sale.
In M&A activity, Dermira (DERM 19.16, +0.82, +4.5%) agreed to be acquired by Eli Lilly (LLY 138.00, +2.08, +1.5%) for $18.75 per share or $1.1 billion in cash.
CURRENCY MARKET WRAP
As of Fri 10 Jan, Singapore Time zone UTC+8
U.S. Dollar Index, +0.12%, 97.42
USDJPY, +0.33%, $109.50
EURUSD, +0.04%, $1.1109
GBPUSD, -0.22%, $1.3069
USDCAD, +0.19%, $1.3063
AUDUSD, -0.18%, $0.6854
NZDUSD, -0.62%, $0.6607
U.S. Initial jobless claims for the week ending January 4 decreased by 9,000 to 214,000 (consensus 225,000). Continuing claims for the week ending December 28 increased by 75,000 to 1.803 million.
The ease in tensions with Iran remained conducive for risk sentiment, even as Trump and Canadian Prime Minister Trudeau echoed a Newsweek report that Iranian missiles shot down the Boeing (BA 336.34, +4.97, +1.5%) 737-800 jetliner earlier this week. There was no indication the U.S. would reconsider its de-escalation strategy, though.
Other positive factors included 1) upbeat holiday sales results, 2) several analyst upgrades, 3) weekly jobless claims returning to lower levels, and 4) China confirming Vice Premier Liu He will visit Washington from Jan. 13-15 to sign the Phase One trade deal.
U.S. Treasuries finished the session slightly higher. The 2-yr yield declined one basis point to 1.57%, and the 10-yr yield declined two basis points to 1.86%. The U.S. Dollar Index increased 0.12% to 97.42. WTI crude declined 0.1% to $59.54/bbl.
STOCK MARKET WRAP
S&P500, +0.67%, 3,274.70
Nasdaq, +0.81%, 9,203.43
Nikkei Futures, +2.54%, 23,737.5
Apple (AAPL 309.63, +6.44, +2.1%) led the information technology sector (+1.1%) higher after Reuters reported that iPhone sales increased 18% yr/yr in China last month. Costco (COST 299.42, +4.73, +1.6%) led the consumer staples sector (+0.7%) higher after it reported 9.0% yr/yr comparable sales growth for the five weeks ended Jan. 5.
Advanced Micro Devices (AMD 48.97, +1.14, +2.4%), Goldman Sachs (GS 242.60, +4.84, +2.0%), and Coca-Cola (KO 55.34, +0.99, +1.8%) were among today’s stocks that were upgraded to the equivalent of a Buy rating.