19 Feb 2020: BAT

Disclaimer: The views and opinions expressed in this material do not constitute a recommendation by TrackRecord Pte Ltd or Gregg Tan and does not have regards to specific investment objectives, financial situation and/or the particular needs of any specific person. The main objective of this material is for educational and discussion purposes only. The technical views and commentaries are to facilitate the finer application of various technical tools.  These technical views may be subject to further revision without notice. No part of this material may be reproduced or transmitted in any form or by any means, electronic, mechanical, photocopying, recording, or otherwise, without prior written permission of TrackRecord Pte Ltd or Gregg Tan.

The reports below are compiled by Gregg. Gregg has over 38 years of experience in the finance industry. His responsibilities in the initial 20 years was mainly with major Financial institutions, spanning across roles as a Trader, Dealer and as Head of Fundamental/ Technical Research of a team in Indonesia. He then spent the next 18 years at Bloomberg as an Application Specialist for Charting and Technical Analysis. Many of Bloomberg’s Institutional clients have acknowledged that they found true value at Gregg’s sessions. Gregg was a key contributor to Bloomberg’s charting ecosystem, as evident when the development team even rescheduled a planned global summit just to accommodate his busy schedule. Gregg has recently joined TrackRecord’s team of professional analysts to value-add to our existing offerings.

Boundaries & Triggers (BAT) – Key technical levels for Short-Term Trading based on Hourly/Intraday Charts

19 February 2020

 Boundaries & Triggers (BAT): 19 Feb 2020

Boundaries And Trigger (BAT) is a complex formula requiring the identification of unique price behaviour, price projections and BAT Triggers. The Triggers are levels that will likely attract immediate follow-through activities when price crosses it.

AUD/USD – 60 Mins (Click to view explanation on usage of BAT and Pivot Points)

EUR/USD – 60 Mins (Click to view explanation on usage of BAT and Pivot Points)

GBP/USD – 60 Mins (Click to view explanation on usage of BAT and Pivot Points)

USD/CHF – 60 Mins (Click to view explanation on usage of BAT and Pivot Points)

USD/JPY – 60 Mins (Click to view explanation on usage of BAT and Pivot Points)

USD/CAD – 60 Mins (Click to view explanation on usage of BAT and Pivot Points)

XAU/USD – 60 Mins (Click to view explanation on usage of BAT and Pivot Points)

2 Min Market Summary: 18 Feb 2020

WHAT HAPPENED YESTERDAY

As of Tue 18 Feb, Singapore Time zone UTC+8

FX MOVES

U.S. Dollar Index, +0.05%, 99.15
USDJPY, +0.04%, $109.83
EURUSD, -0.05%, $1.0836
GBPUSD, -0.35%, $1.3005
USDCAD, -0.06%, $1.3238
AUDUSD, -0.24%, $0.6709
NZDUSD, -0.12%, $0.6438

MARKET MOVES

S&P500, MARKET CLOSED
Dow Jones, MARKET CLOSED
Nasdaq, MARKET CLOSED
Nikkei Futures, -0.46%, 23,390.0

SUMMARY:

U.S. markets were closed on the 17th Feb for Presidents’ Day. There were no notable economic data releases on Monday.

The FX market was quiet given that lack of drivers.

Tuesday started off on the wrong foot with Risk Assets selling off (S&P futures down 0.4%, and AUDJPY down almost 0.5%) after Apple said it will not meet its revenue guidance for the March quarter as the coronavirus outbreak slowed production and weakened demand in China. Also hurting market sentiment was news that the Trump administration is considering changing U.S. regulations to allow it to block shipments of chips to Huawei Technologies from companies such as Taiwan’s TSMC, the world’s largest contract chipmaker.

In China, the number of new COVID-19 cases fell to 1,886 on Monday from 2,048 the day before. The World Health Organization cautioned on Monday, however, that “every scenario is still on the table” in terms of the epidemic’s evolution.

APPLE UNLIKELY TO MEET REVENUE GUIDANCE DUE TO CORONAVIRUS

Apple’s manufacturing facilities in China have begun to reopen, but they are ramping up more slowly than expected, the technology company said in a statement to its investors. Global supplies of Apple’s iPhones will be limited as the sites work toward operating at full capacity, the company said. “These iPhone supply shortages will temporarily affect revenues worldwide,” the company said.

IMPACT: Apple’s stock is expected to face a knee-jerk reaction on Tuesday, when Wall Street reopens after the Presidents’ Day holiday. The importance of Apple cannot be understated as it is seen as a barometer for the health of the US economy and global supply chain/trade and consumer health. Apple’s warning caused a risk off sentiment in the FX and Commodity market as it is a stark reminder of the real economic impact of the virus. Many companies will have to slash guidance and the drag on the economy will be significant.

HUNDREDS OF AMERICANS FLOWN HOME ON CRUISE SHIP, 14 WITH VIRUS

More than 300 American cruise liner passengers, including 14 who tested positive for coronavirus, were flown home to military bases in the United States after two weeks under quarantine off Japan. The cruise ship Diamond Princess, which has more than 400 cases, has by far the largest cluster outside China.

Although U.S. officials had said passengers with coronavirus symptoms would not be repatriated, 14 passengers found at the last minute to have tested positive were permitted to board the planes. The U.S. State Department said the infected passengers were exposed to other passengers for about 40 minutes before they were isolated.

IMPACT: The virus is making landfall on North American soil, if the spread is not well contained, US Risk Assets will be repriced on contagion fears.

US MULLS CUTTING HUAWEI OFF FROM GLOBAL CHIP SUPPLIERS

The Trump administration is considering changing U.S. regulations to allow it to block shipments of chips to Huawei Technologies from companies such as Taiwan’s TSMC, the world’s largest contract chipmaker, two sources familiar with the matter said. New restrictions on commerce with China’s Huawei are among several options to be considered at high-level U.S. meetings this week and next. The chip proposal has been drafted but its approval is far from certain, one of the sources said.

IMPACT: To target global chip sales to Huawei, U.S. authorities would alter the Foreign Direct Product Rule, which subjects some foreign-made goods based on U.S. technology or software to U.S. regulations. Under the draft proposal, the U.S. government would force foreign companies that use U.S. chip-making equipment to seek a U.S. license before supplying Huawei – a major expansion of export control authority that could anger U.S. allies worldwide. This is an escalation of the tensions between US & China and will be negative for risk sentiment.

The Commerce Department declined to comment on the proposal.

DAY AHEAD

UK Jobs figures are up first later today and after last month’s surprise jump in employment growth, investors will be looking to see if a similar momentum was maintained in the three months to December. Wage growth will be closely monitored too given the recent weakness in consumer spending.

ZEW Economic Sentiment index for Eurozone and Germany will likely reaffirm the gloomy outlook for the region. EUR continues to trade heavy as it has been in recent days.

Australia’s labor market will be eyed tomorrow as quarterly wage growth figures are due and the latest employment report is out on Thursday. With the Reserve Bank of Australia looking increasingly reluctant to make deeper cuts to interest rates, the labor market indicators will test policymakers’ economic optimism.

Apart from the devastating bushfires that so far do not appear to have notably dented growth, Australian businesses have also had to grapple with the coronavirus epidemic, which is bound to disrupt trade with China – Australia’s biggest trading partner. The Australian dollar has bounced off 11-year lows on hopes that the outbreak may be slowing.

SENTIMENT

OVERALL SENTIMENT: 

Risk sentiment is starting to weaken as the economic impact of the COVID-19 is starting to show. Expect this to continue.

FX

MARKETS

TRADING TIP

Conviction is a dangerous thing…

Many size their trades according to the strength of their conviction. The stronger the conviction they have in a trade, the bigger risk they will take. This is also why macro traders who lose everything they have typically lose it all on one trade which they are willing to bet everything on. 

Their conviction that this is the best trade that must have on is likely just before it all goes to zero for them! For that reason, it is imperative for every trader to have a risk framework which protects them from risking it all on one trade, no matter how strong their conviction may be. 

Always remember, no matter how good you are, it is a certainty you will be wrong about the markets some day!

18 Feb 2020: BAT

Disclaimer: The views and opinions expressed in this material do not constitute a recommendation by TrackRecord Pte Ltd or Gregg Tan and does not have regards to specific investment objectives, financial situation and/or the particular needs of any specific person. The main objective of this material is for educational and discussion purposes only. The technical views and commentaries are to facilitate the finer application of various technical tools.  These technical views may be subject to further revision without notice. No part of this material may be reproduced or transmitted in any form or by any means, electronic, mechanical, photocopying, recording, or otherwise, without prior written permission of TrackRecord Pte Ltd or Gregg Tan.

The reports below are compiled by Gregg. Gregg has over 38 years of experience in the finance industry. His responsibilities in the initial 20 years was mainly with major Financial institutions, spanning across roles as a Trader, Dealer and as Head of Fundamental/ Technical Research of a team in Indonesia. He then spent the next 18 years at Bloomberg as an Application Specialist for Charting and Technical Analysis. Many of Bloomberg’s Institutional clients have acknowledged that they found true value at Gregg’s sessions. Gregg was a key contributor to Bloomberg’s charting ecosystem, as evident when the development team even rescheduled a planned global summit just to accommodate his busy schedule. Gregg has recently joined TrackRecord’s team of professional analysts to value-add to our existing offerings.

Boundaries & Triggers (BAT) – Key technical levels for Short-Term Trading based on Hourly/Intraday Charts

18 February 2020


 Boundaries & Triggers (BAT): 18 Feb 2020

Boundaries And Trigger (BAT) is a complex formula requiring the identification of unique price behaviour, price projections and BAT Triggers. The Triggers are levels that will likely attract immediate follow-through activities when price crosses it.

AUD/USD – 60 Mins (Click to view explanation on usage of BAT and Pivot Points)

EUR/USD – 60 Mins (Click to view explanation on usage of BAT and Pivot Points)

GBP/USD – 60 Mins (Click to view explanation on usage of BAT and Pivot Points)

USD/CHF – 60 Mins (Click to view explanation on usage of BAT and Pivot Points)

USD/JPY – 60 Mins (Click to view explanation on usage of BAT and Pivot Points)

USD/CAD – 60 Mins (Click to view explanation on usage of BAT and Pivot Points)

XAU/USD – 60 Mins (Click to view explanation on usage of BAT and Pivot Points)

2 Min Market Summary: 17 Feb 2020

WHAT HAPPENED YESTERDAY

As of Fri 17 Feb, Singapore Time zone UTC+8

FX MOVES

U.S. Dollar Index, -0.03%, 99.09
USDJPY, -0.05%, $109.75
EURUSD, -0.08%, $1.0832
GBPUSD, 0.00%, $1.3047
USDCAD, -0.11%, $1.3253
AUDUSD, -0.06%, $0.6715
NZDUSD, +0.06%, $0.6441

MARKET MOVES

S&P500, +0.18%, 3,380.16 
Dow Jones, -0.09%, 29,398.08
Nasdaq, +0.20%, 9,731.18 
Nikkei Futures, -0.67%, 23,630.0

SUMMARY:

The FX market was range-bound yet again, with most pairs trading in a tight range. A move of note was the SGD weakening on the PM’s comments that the economic impact of the COVID-19 will be worse than that of SARS. USDSGD crept 0.3% higher on the day to close at the highs of the year.

The stock market wavered between modest gains and losses on Friday, ultimately closing little changed to preserve the week’s solid gains. The S&P 500 (+0.2%) and Nasdaq Composite (+0.2%) eked out small gains, while the Dow Jones Industrial Average (-0.1%) and Russell 2000 (-0.4%) edged lower. Separately, the White House is considering tax incentives for middle-class Americans to purchase stocks, according to CNBC. The package could be unveiled in early fall prior to the presidential election.

U.S. Treasuries had a good session, driving yields lower across the curve. The 2-yr yield declined five basis points to 1.42%, and the 10-yr yield declined three basis points to 1.58%. The U.S. Dollar Index increased 0.1% to 99.12. WTI crude rose 1.0%, or $0.53, to $51.93/bbl.

US ECONOMIC PRINTS

RETAIL SALES

Total retail sales increased 0.3% m/m in January, as did retail sales, excluding autos. Both were in-line with expectations. There were slight downward revisions to the December data. The key takeaway from the report is that discretionary spending was modest in January, which will contribute to a sense that Q1 GDP growth is apt to be modest even without any impact from the coronavirus.

INDUSTRIAL PRODUCTION

Industrial production declined 0.3% m/m in January, as expected, following a downwardly revised 0.4% decline (from -0.3%) in December. Total capacity utilization was 76.8%, as expected, following an upwardly revised 77.1% (from 77.0%) in December. The key takeaway is that the weakness in production stemmed largely from a drop in production at Boeing and warmer-than-normal temperatures that reduced heating demand and weighed on the output of utilities.

UNIVERSITY OF MICHIGAN CONSUMER SENTIMENT

The preliminary University of Michigan Index of Consumer Sentiment for February increased to 100.9 (consensus 99.2) from the final reading of 99.8 for January. That was just shy of the expansion peak of 101.4 seen in March 2018. The key takeaway is that positive consumer attitudes continue to be underpinned by a favorable move of the outlook, which is tied in large part to feeling of job security and income growth prospects.

IMPACT: US economic prints were mostly inline with expectations, reinforcing the theme that North America continues to be a pocket of economic strength.

GERMAN ECONOMY STAGNATES

The German economy stagnated in the fourth quarter due to weaker private consumption and state spending, data showed on Friday, renewing fears of a recession just as Chancellor Angela Merkel’s conservatives are preoccupied with a search for a new leader. The outlook for the German economy is also darkened by uncertainties linked to Britain’s Jan. 31 exit from the European Union as well as a threat by U.S. President Donald Trump to impose higher tariffs on car imports from Europe. Germany’s DIHK Chambers of Industry and Commerce said the quarterly stagnation should be a wake-up call for the government to increase investments and cut corporate taxes.

IMPACT: Europe continues to struggle coming to an agreement on a fiscal stimulus package that will boost its waning manufacturing sector. The EU’s push towards carbon free initiatives will put pressure on Germany’s traditional automobile industry and the EU will need to come to a consensus in time on what kind of monetary policy they want to use to ensure economic stability.

TRUMP ADMINISTRATION CONSIDERS PROPOSING TAX FREE INVESTING

The Trump administration is considering making it possible for Americans to invest more in the stock market on a tax-free basis, according to a CNBC report on Friday citing four unnamed administration officials. Households earning up to $200,000 a year could invest $10,000 on a tax-free basis outside a 401(k) retirement account in one proposal under consideration, the report said.

Friday’s report is another instance of the White House hinting at fresh tax cuts from President Donald Trump that would come before the November election. Last year, economic adviser Larry Kudlow said “tax cuts 2.0” might come during Trump’s re-election campaign.

IMPACT: This piece of news is bullish for risk assets as it’s a form of fiscal stimulus. By leveraging on a potentially massive pool of unencumbered public liquidity and the conditioning that every dip will be supported by central banks, asset prices might continue higher as American savers will want to take part in a secularly bullish stock market.

DAY AHEAD

Expect thinner markets as the US markets are closed for Presidents’ Day. The week started off with weaker than expected Q4 GDP from Japan (actual annualized rate of -6.3% vs expected -3.7%, with previous print revised lower from 1.8% to 0.5%). Data showing that the economy was slowing even before the COVID-19 hit is not a good sign. 

The preliminary PMIs for February will take center stage this week as they will provide the first insight into the possible impact of the coronavirus on the global economy. The flash releases in the Eurozone, Japan, the United Kingdom, and the United States should reveal how businesses outside of China have been affected by the outbreak with the risk that runaway equity markets may be handed a tough reality check. In other data, Australian employment and Canadian and UK retail sales will be watched closely, while in Japan, fourth-quarter GDP numbers are likely to renew pressure on policymakers for additional stimulus measures.

SENTIMENT

OVERALL SENTIMENT: 

Risk sentiment should be neutral on the day without the usual boost from the positive price action from the US stock markets. Volatility remains low but caution on the growing negative impact of the COVID-19 situation will continue to gain traction. EUR remains weak and rallies will be met with selling.

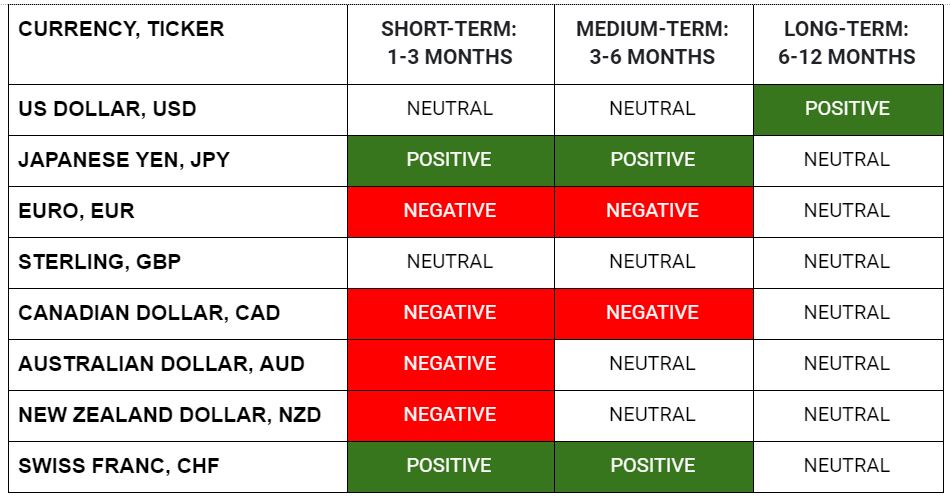
i.e. CCY, Ticker (Short-Term: 1-3 MONTHS, Medium-Term: 3-6 MONTHS, Long-Term: 6-12 MONTHS)

FX

US DOLLAR, USD (Neutral, Neutral, +ve)

JAPANESE YEN, JPY (+ve, +ve, Neutral)

EURO, EUR (-ve, -ve, Neutral)

STERLING, GBP (Neutral, Neutral, Neutral)

CANADIAN DOLLAR, CAD (-ve, -ve, Neutral)

AUSTRALIAN DOLLAR, AUD (-ve, Neutral, Neutral)

NEW ZEALAND DOLLAR, NZD (-ve, Neutral, Neutral)

SWISS FRANC, CHF (+ve, +ve, Neutral)
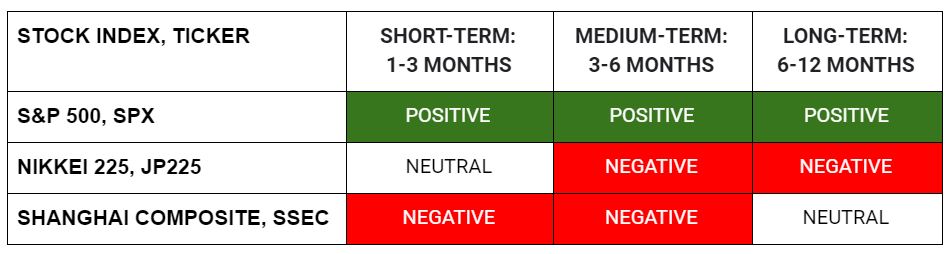
MARKETS

S&P 500, SPX (+ve, +ve, +ve)

NIKKEI 225, JP225 (Neutral, -ve, -ve)

SHANGHAI COMPOSITE, SSEC (-ve, -ve, Neutral)

TRADING TIP

It is time to prepare…

Contrary to popular belief, successful traders don’t tend to spend their days clicking away and trading like maniacs. Unless, of course, you are a high frequency trader, and even then, the clicking and trading are mostly done by algorithms. 

The days of trying to trade frequently in the hope of making a profit are pretty much over as we are now living in the age where algorithms can outperform humans when it comes to things like this. Much of the time is spent, instead, on preparing for the next trading opportunity. 

This is especially true when volatility is low. Environments like these tend to lead to careless and complacent trades. Low volatility environments are the best time to do the required homework (improving your risk framework, money management process, etc) and be prepared for the opportunities that are bound to appear in time to come. 

Get prepared and be ready!

17 Feb 2020: BAT, HIM, A Technician’s Perspective

Disclaimer: The views and opinions expressed in this material do not constitute a recommendation by TrackRecord Pte Ltd or Gregg Tan and does not have regards to specific investment objectives, financial situation and/or the particular needs of any specific person. The main objective of this material is for educational and discussion purposes only. The technical views and commentaries are to facilitate the finer application of various technical tools.  These technical views may be subject to further revision without notice. No part of this material may be reproduced or transmitted in any form or by any means, electronic, mechanical, photocopying, recording, or otherwise, without prior written permission of TrackRecord Pte Ltd or Gregg Tan.

The reports below are compiled by Gregg. Gregg has over 38 years of experience in the finance industry. His responsibilities in the initial 20 years was mainly with major Financial institutions, spanning across roles as a Trader, Dealer and as Head of Fundamental/ Technical Research of a team in Indonesia. He then spent the next 18 years at Bloomberg as an Application Specialist for Charting and Technical Analysis. Many of Bloomberg’s Institutional clients have acknowledged that they found true value at Gregg’s sessions. Gregg was a key contributor to Bloomberg’s charting ecosystem, as evident when the development team even rescheduled a planned global summit just to accommodate his busy schedule. Gregg has recently joined TrackRecord’s team of professional analysts to value-add to our existing offerings.

Boundaries & Triggers (BAT) – Key technical levels for Short-Term Trading based on Hourly/Intraday Charts

17 February 2020

 Boundaries & Triggers (BAT): 17 Feb 2020 

Boundaries And Trigger (BAT) is a complex formula requiring the identification of unique price behaviour, price projections and BAT Triggers. The Triggers are levels that will likely attract immediate follow-through activities when price crosses it.

AUD/USD – 60 Mins (Click to view explanation on usage of BAT and Pivot Points)

EUR/USD – 60 Mins (Click to view explanation on usage of BAT and Pivot Points)

GBP/USD – 60 Mins (Click to view explanation on usage of BAT and Pivot Points)

USD/CHF – 60 Mins (Click to view explanation on usage of BAT and Pivot Points)

USD/JPY – 60 Mins (Click to view explanation on usage of BAT and Pivot Points)

USD/CAD – 60 Mins (Click to view explanation on usage of BAT and Pivot Points)

XAU/USD – 60 Mins (Click to view explanation on usage of BAT and Pivot Points)


A Technician’s Perspective – Key technical levels based on daily/weekly charts and technical prognoses up to 4 weeks ahead

15 Feb 2020

A Technician’s Perspective: 15 Feb 2020 

AUDUSD – DAILY

GOLD SPOT – MONTHLY

USDCAD – DAILY

Historical Identical Movements (HIM) – Likely Long-Term Moves based on similar patterns in the past

14 Feb 2020

 Historical Identical Movements (HIM): 14 Feb 2020 

Humans are creatures of habit and oftentimes react in a similar way to identical financial events or price swings. These emotional reactions are reflected in price activities which can be visualised on a chart. The Historical Identical Movements (HIM) displayed below reveals an almost identical movement in its past, if HIM were to repeat, it can be used as a visual guide for movements ahead. Be forewarned that I rely on various charting techniques and technical tools for my actual market analysis. All analysis only attempts to forecast the likely movement ahead, HIM provides an ‘insight’ into how price could unfold ahead of time. Do note that HIM employs a totally different approach from “A Technician’s Perspective” report. HIM’s sole purpose is to locate Historical Identical Movements that are almost identical to current price setup. Should projected path in HIM (movement after the light blue demarcation) align with “A Technician’s Perspective” report – it is at best a visual guide to how price could unfold.


4 Feb 2020: BAT

Disclaimer: The views and opinions expressed in this material do not constitute a recommendation by TrackRecord Pte Ltd or Gregg Tan and does not have regards to specific investment objectives, financial situation and/or the particular needs of any specific person. The main objective of this material is for educational and discussion purposes only. The technical views and commentaries are to facilitate the finer application of various technical tools.  These technical views may be subject to further revision without notice. No part of this material may be reproduced or transmitted in any form or by any means, electronic, mechanical, photocopying, recording, or otherwise, without prior written permission of TrackRecord Pte Ltd or Gregg Tan.

The reports below are compiled by Gregg. Gregg has over 38 years of experience in the finance industry. His responsibilities in the initial 20 years was mainly with major Financial institutions, spanning across roles as a Trader, Dealer and as Head of Fundamental/ Technical Research of a team in Indonesia. He then spent the next 18 years at Bloomberg as an Application Specialist for Charting and Technical Analysis. Many of Bloomberg’s Institutional clients have acknowledged that they found true value at Gregg’s sessions. Gregg was a key contributor to Bloomberg’s charting ecosystem, as evident when the development team even rescheduled a planned global summit just to accommodate his busy schedule. Gregg has recently joined TrackRecord’s team of professional analysts to value-add to our existing offerings.

Boundaries & Triggers (BAT) – Key technical levels for Short-Term Trading based on Hourly/Intraday Charts

4 February 2020

 Boundaries & Triggers (BAT): 4 Feb 2020 

Boundaries And Trigger (BAT) is a complex formula requiring the identification of unique price behaviour, price projections and BAT Triggers. The Triggers are levels that will likely attract immediate follow-through activities when price crosses it.

AUD/USD – 60 Mins (Click to view explanation on usage of BAT and Pivot Points)

EUR/USD – 60 Mins (Click to view explanation on usage of BAT and Pivot Points)

GBP/USD – 60 Mins (Click to view explanation on usage of BAT and Pivot Points)

USD/CHF – 60 Mins (Click to view explanation on usage of BAT and Pivot Points)

USD/JPY – 60 Mins (Click to view explanation on usage of BAT and Pivot Points)

USD/CAD – 60 Mins (Click to view explanation on usage of BAT and Pivot Points)

3 Feb 2020: BAT, HIM, A Technician’s Perspective

Disclaimer: The views and opinions expressed in this material do not constitute a recommendation by TrackRecord Pte Ltd or Gregg Tan and does not have regards to specific investment objectives, financial situation and/or the particular needs of any specific person. The main objective of this material is for educational and discussion purposes only. The technical views and commentaries are to facilitate the finer application of various technical tools.  These technical views may be subject to further revision without notice. No part of this material may be reproduced or transmitted in any form or by any means, electronic, mechanical, photocopying, recording, or otherwise, without prior written permission of TrackRecord Pte Ltd or Gregg Tan.

The reports below are compiled by Gregg. Gregg has over 38 years of experience in the finance industry. His responsibilities in the initial 20 years was mainly with major Financial institutions, spanning across roles as a Trader, Dealer and as Head of Fundamental/ Technical Research of a team in Indonesia. He then spent the next 18 years at Bloomberg as an Application Specialist for Charting and Technical Analysis. Many of Bloomberg’s Institutional clients have acknowledged that they found true value at Gregg’s sessions. Gregg was a key contributor to Bloomberg’s charting ecosystem, as evident when the development team even rescheduled a planned global summit just to accommodate his busy schedule. Gregg has recently joined TrackRecord’s team of professional analysts to value-add to our existing offerings.

Boundaries & Triggers (BAT) – Key technical levels for Short-Term Trading based on Hourly/Intraday Charts

3 February 2020

 Boundaries & Triggers (BAT): 3 Feb 2020 

Boundaries And Trigger (BAT) is a complex formula requiring the identification of unique price behaviour, price projections and BAT Triggers. The Triggers are levels that will likely attract immediate follow-through activities when price crosses it.

AUD/USD – 60 Mins (Click to view explanation on usage of BAT and Pivot Points)

EUR/USD – 60 Mins (Click to view explanation on usage of BAT and Pivot Points)

GBP/USD – 60 Mins (Click to view explanation on usage of BAT and Pivot Points)

USD/CHF – 60 Mins (Click to view explanation on usage of BAT and Pivot Points)

USD/JPY – 60 Mins (Click to view explanation on usage of BAT and Pivot Points)

USD/CAD – 60 Mins (Click to view explanation on usage of BAT and Pivot Points)


A Technician’s Perspective – Key technical levels based on daily/weekly charts and technical prognoses up to 4 weeks ahead

1 Feb 2020

A Technician’s Perspective: 31 Jan 2020 

XAUUSD – MONTHLY

GBP/JPY – WEEKLY

USD/CAD – DAILY

Historical Identical Movements (HIM) – Likely Long-Term Moves based on similar patterns in the past

31 Jan 2020

 Historical Identical Movements (HIM): 31 Jan 2020 

Humans are creatures of habit and oftentimes react in a similar way to identical financial events or price swings. These emotional reactions are reflected in price activities which can be visualised on a chart. The Historical Identical Movements (HIM) displayed below reveals an almost identical movement in its past, if HIM were to repeat, it can be used as a visual guide for movements ahead. Be forewarned that I rely on various charting techniques and technical tools for my actual market analysis. All analysis only attempts to forecast the likely movement ahead, HIM provides an ‘insight’ into how price could unfold ahead of time. Do note that HIM employs a totally different approach from “A Technician’s Perspective” report. HIM’s sole purpose is to locate Historical Identical Movements that are almost identical to current price setup. Should projected path in HIM (movement after the light blue demarcation) align with “A Technician’s Perspective” report – it is at best a visual guide to how price could unfold.

28 Jan 2020: BAT

Disclaimer: The views and opinions expressed in this material do not constitute a recommendation by TrackRecord Pte Ltd or Gregg Tan and does not have regards to specific investment objectives, financial situation and/or the particular needs of any specific person. The main objective of this material is for educational and discussion purposes only. The technical views and commentaries are to facilitate the finer application of various technical tools.  These technical views may be subject to further revision without notice. No part of this material may be reproduced or transmitted in any form or by any means, electronic, mechanical, photocopying, recording, or otherwise, without prior written permission of TrackRecord Pte Ltd or Gregg Tan.

 Boundaries & Triggers (BAT): 28 Jan 2020 

Boundaries And Trigger (BAT) is a complex formula requiring the identification of unique price behaviour, price projections and BAT Triggers. The Triggers are levels that will likely attract immediate follow-through activities when price crosses it.

AUD/USD – 60 Mins (Click to view explanation on usage of BAT and Pivot Points)

EUR/USD – 60 Mins (Click to view explanation on usage of BAT and Pivot Points)

GBP/USD – 60 Mins (Click to view explanation on usage of BAT and Pivot Points)

USD/CHF – 60 Mins (Click to view explanation on usage of BAT and Pivot Points)

USD/JPY – 60 Mins (Click to view explanation on usage of BAT and Pivot Points)

USD/CAD – 60 Mins (Click to view explanation on usage of BAT and Pivot Points)


The charts above are compiled by Gregg. Gregg has over 38 years of experience in the finance industry. His responsibilities in the initial 20 years was mainly with major Financial institutions, spanning across roles as a Trader, Dealer and as Head of Fundamental/ Technical Research of a team in Indonesia. He then spent the next 18 years at Bloomberg as an Application Specialist for Charting and Technical Analysis. Many of Bloomberg’s Institutional clients have acknowledged that they found true value at Gregg’s sessions. Gregg was a key contributor to Bloomberg’s charting ecosystem, as evident when the development team even rescheduled a planned global summit just to accommodate his busy schedule. Gregg has recently joined TrackRecord’s team of professional analysts to value-add to our existing offerings.

27 Jan 2020: BAT, HIM, A Technician’s Perspective

Disclaimer: The views and opinions expressed in this material do not constitute a recommendation by TrackRecord Pte Ltd or Gregg Tan and does not have regards to specific investment objectives, financial situation and/or the particular needs of any specific person. The main objective of this material is for educational and discussion purposes only. The technical views and commentaries are to facilitate the finer application of various technical tools.  These technical views may be subject to further revision without notice. No part of this material may be reproduced or transmitted in any form or by any means, electronic, mechanical, photocopying, recording, or otherwise, without prior written permission of TrackRecord Pte Ltd or Gregg Tan.

 Historical Identical Movements (HIM): 27 Jan 2020 

Humans are creatures of habit and oftentimes react in a similar way to identical financial events or price swings. These emotional reactions are reflected in price activities which can be visualised on a chart. The Historical Identical Movements (HIM) displayed below reveals an almost identical movement in its past, if HIM were to repeat, it can be used as a visual guide for movements ahead. Be forewarned that I rely on various charting techniques and technical tools for my actual market analysis. All analysis only attempts to forecast the likely movement ahead, HIM provides an ‘insight’ into how price could unfold ahead of time.

Do note that HIM employs a totally different approach from “A Technician’s Perspective” report. HIM’s sole purpose is to locate Historical Identical Movements that are almost identical to current price setup. Should projected path in HIM (movement after the light blue demarcation) align with “A Technician’s Perspective” report – it is at best a visual guide to how price could unfold.

 Boundaries & Triggers (BAT): 27 Jan 2020 

Boundaries And Trigger (BAT) is a complex formula requiring the identification of unique price behaviour, price projections and BAT Triggers. The Triggers are levels that will likely attract immediate follow-through activities when price crosses it.

AUD/USD – 60 Mins (Click to view explanation on usage of BAT and Pivot Points)

EUR/USD – 60 Mins (Click to view explanation on usage of BAT and Pivot Points)

GBP/USD – 60 Mins (Click to view explanation on usage of BAT and Pivot Points)

USD/CHF – 60 Mins (Click to view explanation on usage of BAT and Pivot Points)

USD/JPY – 60 Mins (Click to view explanation on usage of BAT and Pivot Points)

USD/CAD – 60 Mins (Click to view explanation on usage of BAT and Pivot Points)

A Technician’s Perspective: 24 Jan 2020 

GBP/USD – DAILY

AUD/JPY – DAILY

USD/CAD – DAILY

The charts above are compiled by Gregg. Gregg has over 38 years of experience in the finance industry. His responsibilities in the initial 20 years was mainly with major Financial institutions, spanning across roles as a Trader, Dealer and as Head of Fundamental/ Technical Research of a team in Indonesia. He then spent the next 18 years at Bloomberg as an Application Specialist for Charting and Technical Analysis. Many of Bloomberg’s Institutional clients have acknowledged that they found true value at Gregg’s sessions. Gregg was a key contributor to Bloomberg’s charting ecosystem, as evident when the development team even rescheduled a planned global summit just to accommodate his busy schedule. Gregg has recently joined TrackRecord’s team of professional analysts to value-add to our existing offerings.

2 Min Market Update : 24 Jan 2020

MARKET WRAP 

As of Fri 24 Jan, Singapore Time zone UTC+8

FX MOVES

U.S. Dollar Index, +0.19%, 97.484 (Sentiment: Negative)            
USDJPY, -0.25%, $109.57 (Sentiment: Neutral)
EURUSD, +0.11%, $1.1096 (Sentiment: Neutral)    
GBPUSD, -0.18%, $1.3118 (Sentiment: Neutral)    
USDCAD, -0.06%, $1.3128 (Sentiment: Positive)
AUDUSD, +0.06%, $0.6849 (Sentiment: Neutral)    
NZDUSD, +0.35%, $0.6616 (Sentiment: Neutral)

MARKET MOVES

S&P500, +0.32%, 3,330.38 (Sentiment: Positive)
Nasdaq,  +0.81%, 9,270.00 (Sentiment: Positive)
Nikkei Futures, -0.98%, 23,795.44 (Sentiment: Positive)

MARKET OUTLOOK :  The S&P 500 lost as much as 0.6% on Thursday amid concerns about growth and valuation, but an intraday rebound gathered steam after the World Health Organization declined to declare an international virus alert or public health emergency for the coronavirus. The benchmark index finished the session up 0.1%.

SUMMARY OF NOTABLE EVENTS 

EUROPEAN CENTRAL BANK MONETARY POLICY

The ECB kept its ultra loose monetary policy rates unchanged on Thursday, said it would reconsider the inflation target that defines is core price stability mandate. In ECB’s Q&A, Lagarde commented that Governments with fiscal space should be ready to act and if growth does not pick up, they have to decide on which part of the yield curve they want to operate on. The fall in the euro through the press conference shows that the market was leaning towards something hawkish, at least on negative rates. Instead Lagarde was pushing governments to spend and not offering any hint about a hawkish shift.

NEW ZEALAND INFLATION PRINT 

The New Zealand inflation data for Q4 came in at 0.5% q/q (expected 0.4%) and 1.9% y/y (expected 1.8%). Kiwi popped higher as a result.

CHINA VIRUS DEATH TOLL INCREASES TO 25 AS TRAVEL LIMITS EXPANDED

China reported that deaths from a new coronavirus rose to 25 as it rushes to halt the SARS-like disease, even as the World Health Organization stopped short of calling the infection a global health emergency. Restrictions on travel and public gatherings have been implemented in Wuhan, the city in central China where the virus was first detected, as well as in several nearby municipalities. Hong Kong and Beijing are canceling planned holiday activities, according to local officials and state media. Investors took a cautious stance ahead of a week long trading break, pushing the Shanghai Composite down by -2.80%.