
USD/ZAR Daily Candlesticks & Ichimoku Chart – SHORT
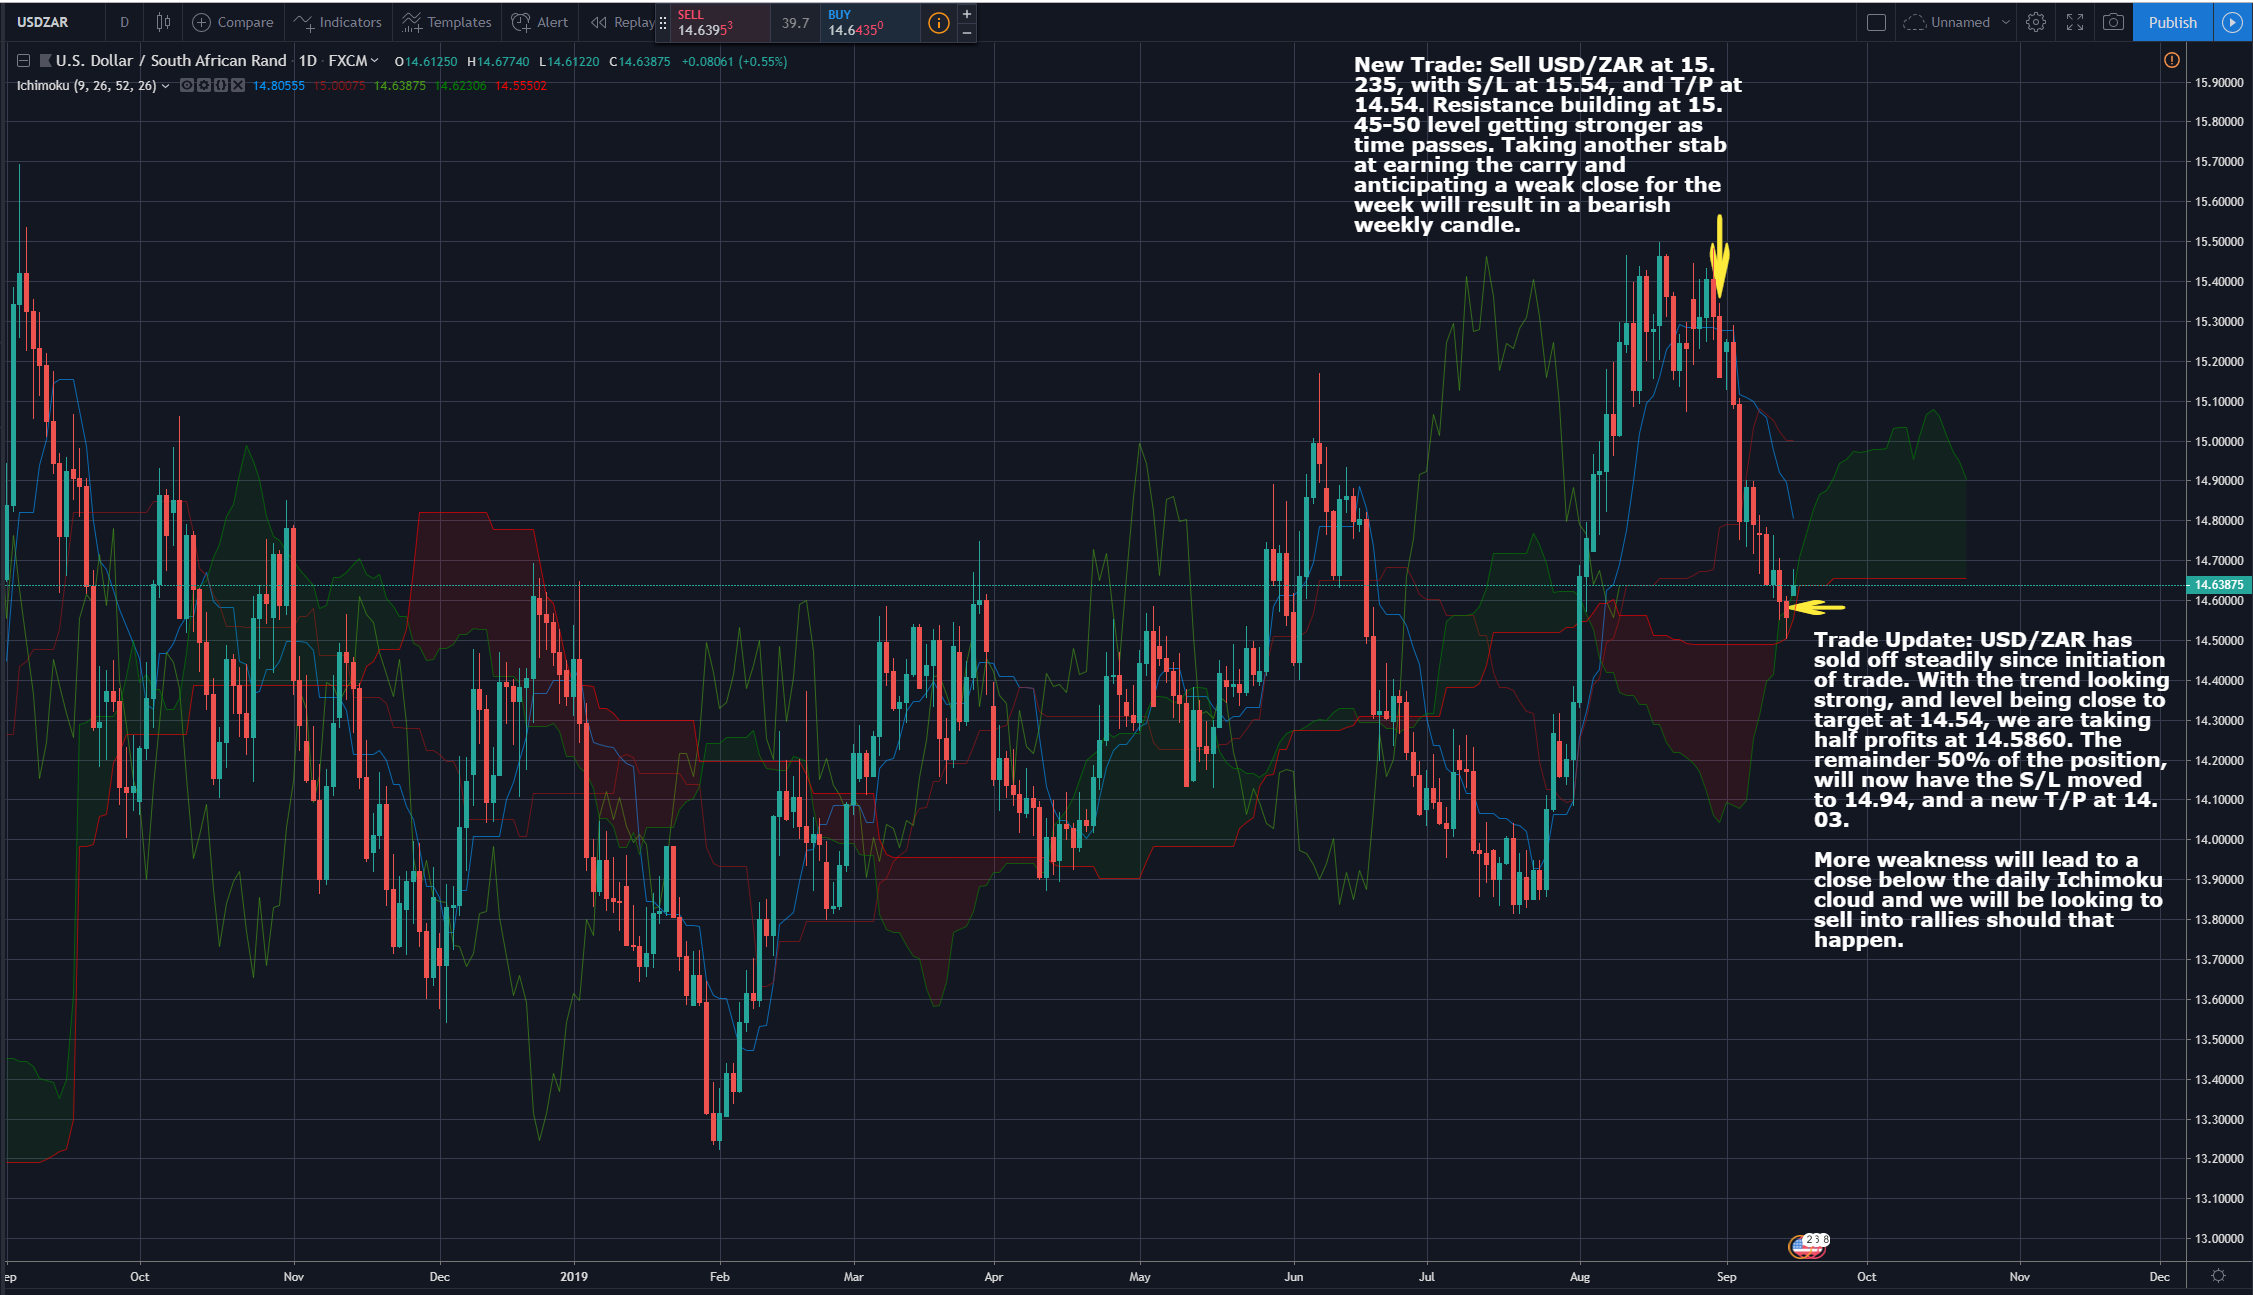
30 Aug: New Trade: Sell USD/ZAR at 15.235, with S/L at 15.54, and T/P at 14.54. Resistance building at 15.45-50 level getting stronger as time passes. Taking another stab at earning the carry and anticipating a weak close for the week will result in a bearish weekly candle.
13 Sep: Trade Update: USD/ZAR has sold off steadily since initiation of trade. With the trend looking strong, and level being close to target at 14.54, we are taking half profits at 14.5860. The remainder 50% of the position will now have the S/L moved to 14.94, and a new T/P at 14.03.
More weakness will lead to a close below the daily ichimoku cloud and we will be looking to sell into rallies should that happen.
CURRENT PROMO: Subscribe now at $1/month to receive the above earlier than the others as well as key macro analysis from our CIO, Vee on a weekly basis!
Vee, our Founder/CIO highlights patterns/formations on selected chart(s) every week which may have the potential to turn into trading opportunities. These charts are first sent out on Monday of the week to members subscribed to THE LONG & SHORT OF IT, which helps you to filter out the noise and condense only what’s important in the markets for the week ahead.
Disclaimer: The views and opinions expressed in this material do not constitute a recommendation by TrackRecord Pte. Ltd. that any particular investment, security, transaction or investment strategy is suitable for any specific person. No part of this material may be reproduced or transmitted in any form or by any means, electronic, mechanical, photocopying, recording, or otherwise, without prior written permission of TrackRecord Pte. Ltd