Charts of the Week (25 Jun 2018)

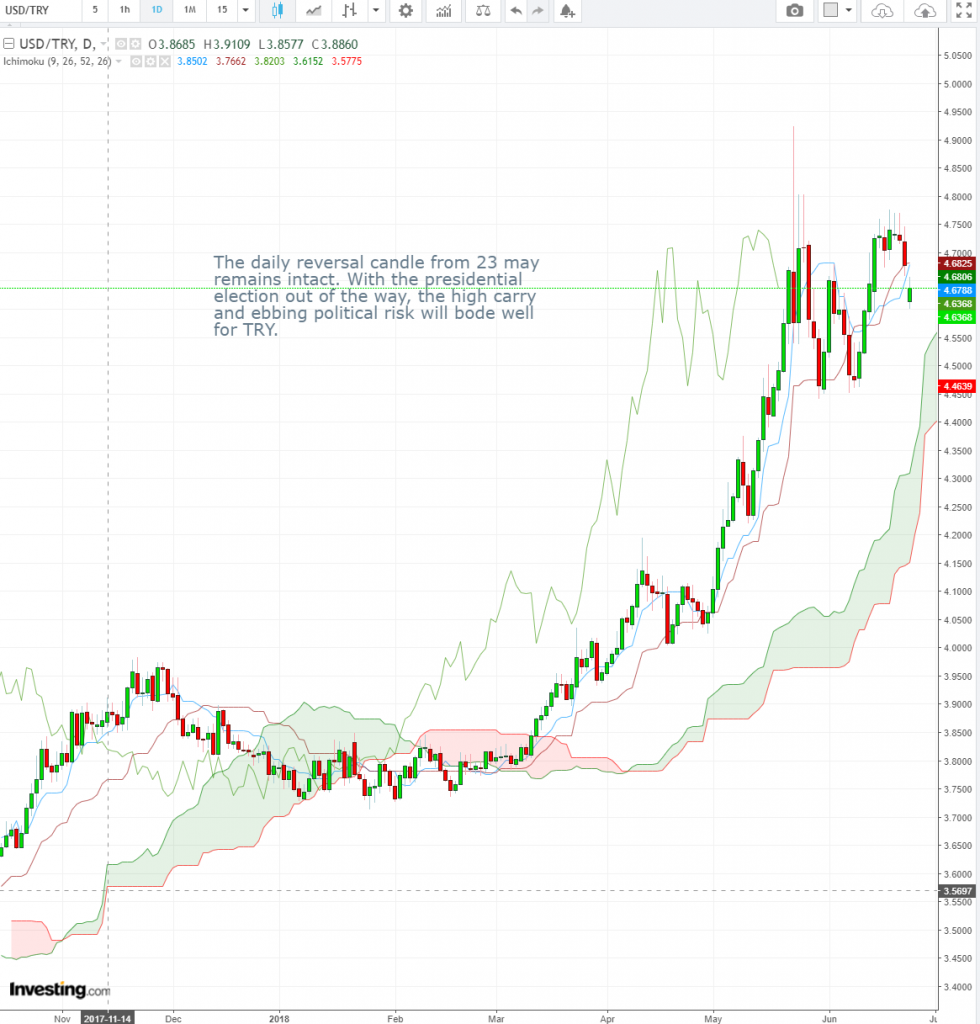
USD/TRY Daily Candlesticks & Ichimoku Chart
The daily reversal candle from 23 May remains intact. With the presidential elections out of the way, the high carry and ebbing political risk will bode well for TRY.


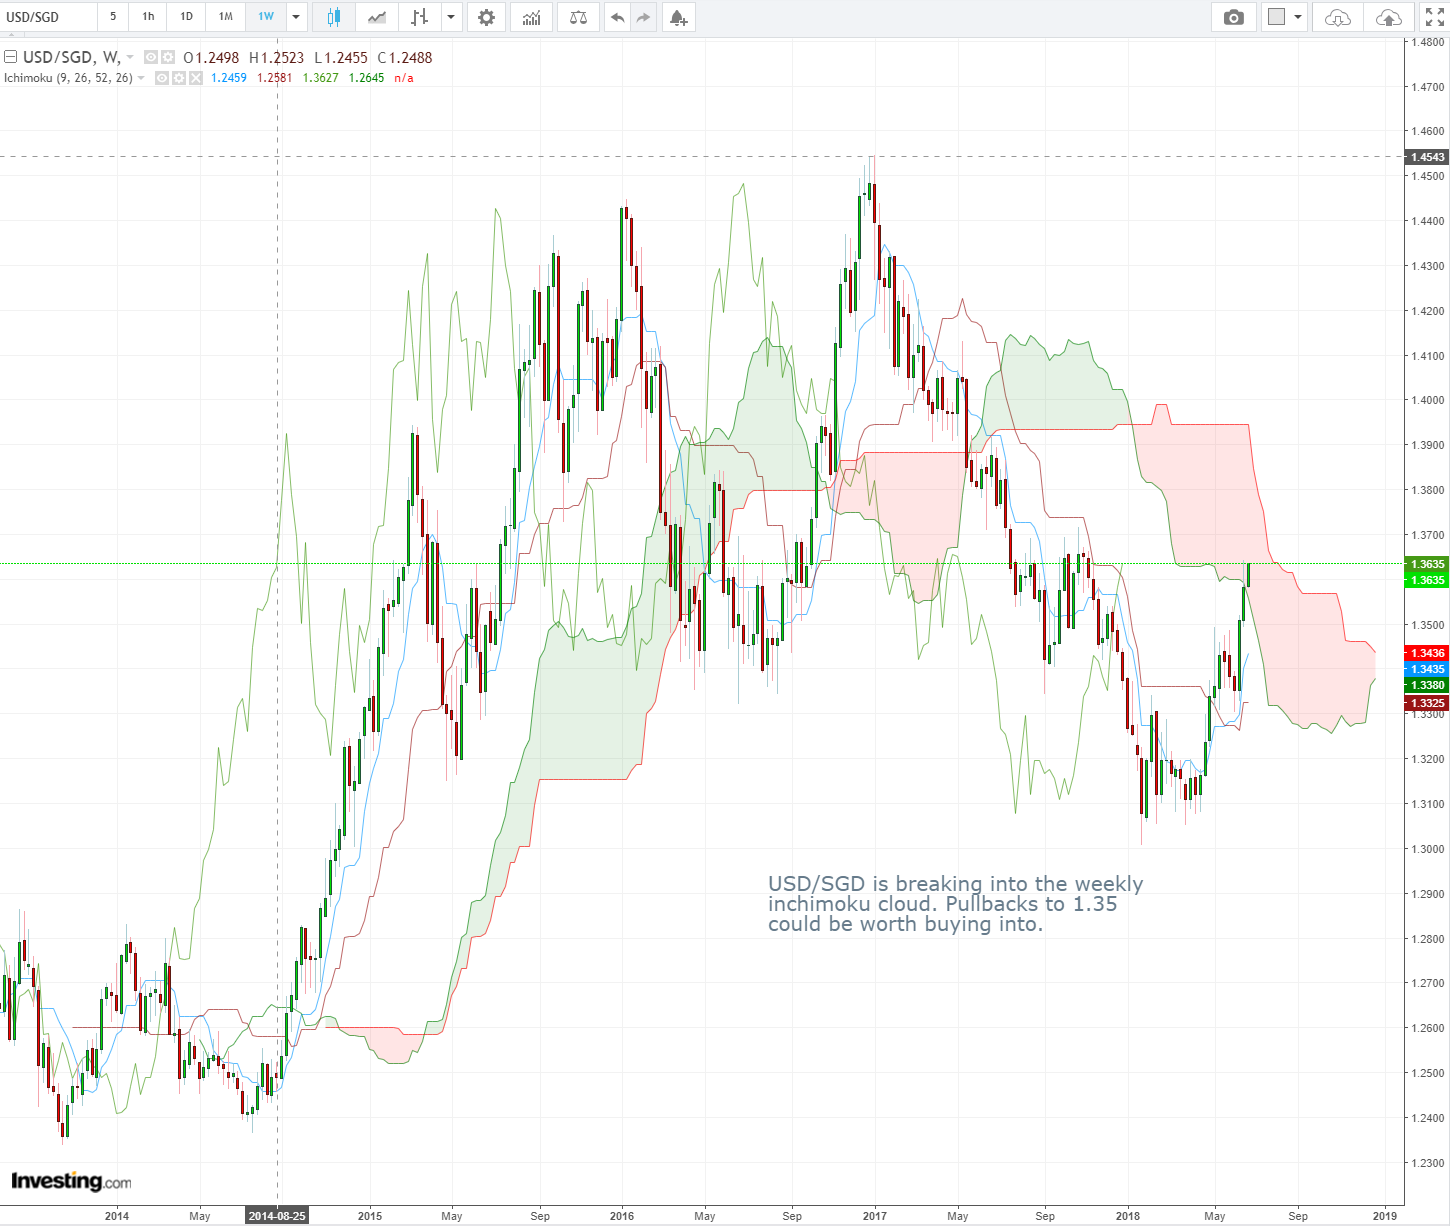
USD/SGD Weekly Candlesticks & Ichimoku Chart
USD/SGD is breaking into the weekly ichimoku cloud. Pullbacks to 1.35 could be worth buying into.


Vee, our Founder/CIO highlights patterns/formations on selected chart(s) every week which may have the potential to turn into trading opportunities. These charts are extracts of our weekly subscription product – “CIO’s Week Ahead Update” which provides analysis for the week ahead, first sent out on Monday of the week.

Receive first hand information on these charts and learn how to leverage on possible trading opportunities >>> Click here!

Charts of the Week (19 Jun 2018)

Facebook (FB) Weekly Candlesticks & Ichimoku Chart
Despite FB’s recent troubles, the stock has recovered from the lows and is making new highs. What can stop this strong uptrend?


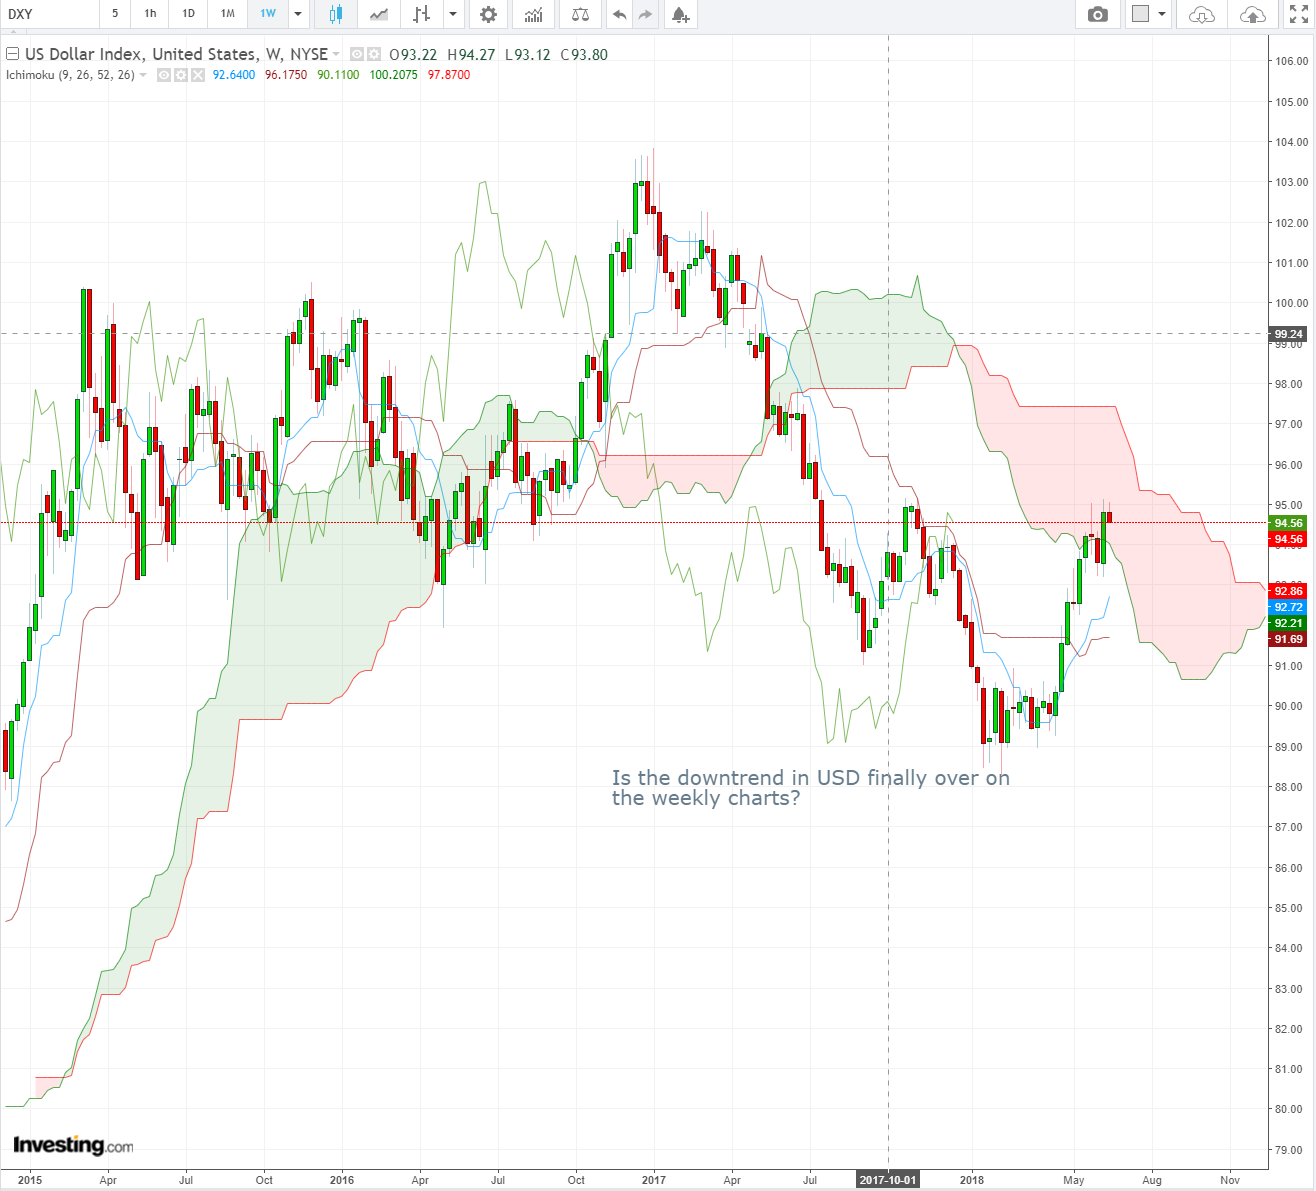
DXY (USD Index) Weekly Candlesticks & Ichimoku Chart
Is the downtrend in USD finally over on the weekly charts?


Vee, our Founder/CIO highlights patterns/formations on selected chart(s) every week which may have the potential to turn into trading opportunities.

These charts are extracts of our weekly subscription product – “CIO’s Week Ahead Update” which provides analysis for the week ahead, first sent out on Monday of the week.

Want to receive first hand information on these charts and learn how to leverage on possible trading opportunities? Click here!

Charts of the Week (11 Jun 2018)

GBP/USD Weekly Candlesticks & Ichimoku Chart
GBP/USD seems supported by the weekly cloud


AUD/JPY Daily Candlesticks & Ichimoku Chart
Is it time to buy the next dip?


Vee, our Founder/CIO highlights patterns/formations on selected chart(s) every week which may have the potential to turn into trading opportunities.

These charts are extracts of our weekly subscription product – “CIO’s Week Ahead Update” which provides analysis for the week ahead, first sent out on Monday of the week.

Want to receive first hand information on these charts and learn how to leverage on possible trading opportunities? Click here!

Charts of the Week (5 Jun 2018)

Nasdaq Daily Candlesticks & Ichimoku Chart  
Nasdaq posted a new closing high yesterday. As pointed out in our 14 May report, after a few months of consolidation, the market is poised for higher highs!


AUD/CAD Daily Candlesticks & Ichimoku Chart
Will AUD/CAD soon break above the cloud? The Canadian job report on Fri could be the key to answer this.


Vee, our Founder/CIO highlights patterns/formations on selected chart(s) every week which may have the potential to turn into trading opportunities.

These charts are extracts of our weekly subscription product – “CIO’s Week Ahead Update” which provides analysis for the week ahead, first sent out on Monday of the week.

Want to receive first hand information on these charts and learn how to leverage on possible trading opportunities? Click here!