
Listen to TrackRecord’s CIO, Phan Vee Leung speak with Ryan Huang of MoneyFM 89.3 (SPH Radio) about the FX market this week!
Fresh off LIVE radio this morning!
Listen to TrackRecord’s CIO, Phan Vee Leung speak with Ryan Huang of MoneyFM 89.3 (SPH Radio) about the FX market this week!
Fresh off LIVE radio this morning!

EUR/USD Weekly Candlesticks & Ichimoku Chart
EUR/USD reaching support on the weekly Ichimoku cloud soon.
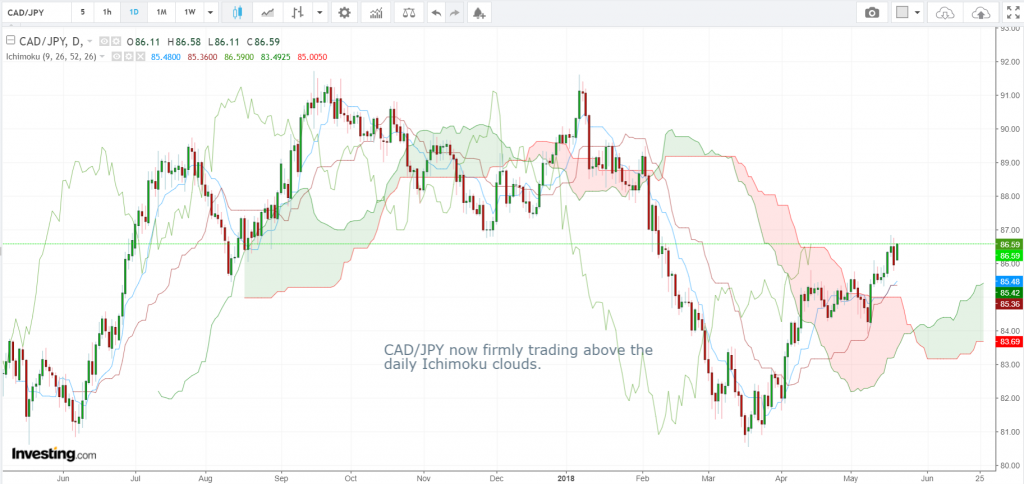
CAD/JPY Daily Candlesticks & Ichimoku Chart
CAD/JPY now firmly trading above the daily Ichimoku clouds
Vee, our Founder/CIO highlights patterns/formations on selected chart(s) every week which may have the potential to turn into trading opportunities.
These charts are extracts of our weekly subscription product – “CIO’s Week Ahead Update” which provides analysis for the week ahead, first sent out on Monday of the week.
Want to receive first hand information on these charts and learn how to leverage on possible trading opportunities? Click here!
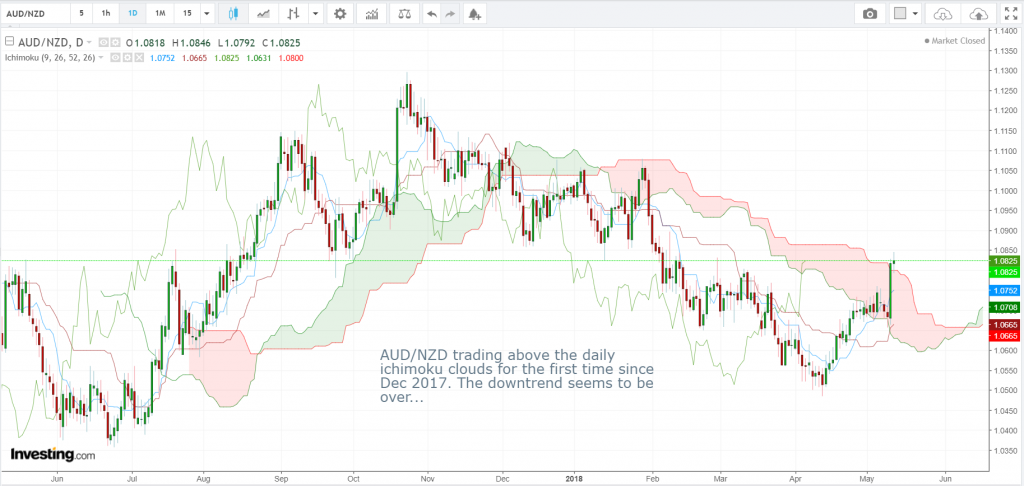
AUD/NZD Daily Candlesticks & Ichimoku Chart
AUD/NZD trading above the daily ichimoku clouds for the first time since Dec 2017. The downtrend seems to be over…
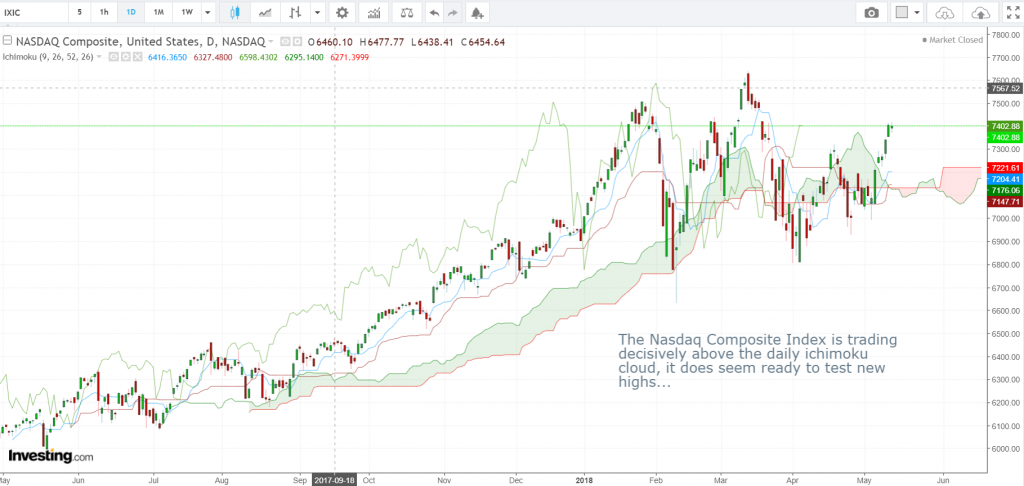
NASDAQ Composite Index Daily Candlesticks & Ichimoku Chart
The Nasdaq Composite Index is trading decisively above the daily Ichimoku cloud, it does seem ready to test new highs…
Vee, our Founder/CIO highlights patterns/formations on selected chart(s) every week which may have the potential to turn into trading opportunities.
These charts are extracts of our weekly subscription product – “CIO’s Week Ahead Update” which provides analysis for the week ahead, first sent out on Monday of the week.
Want to receive first hand information on these charts and learn how to leverage on possible trading opportunities? Click here!
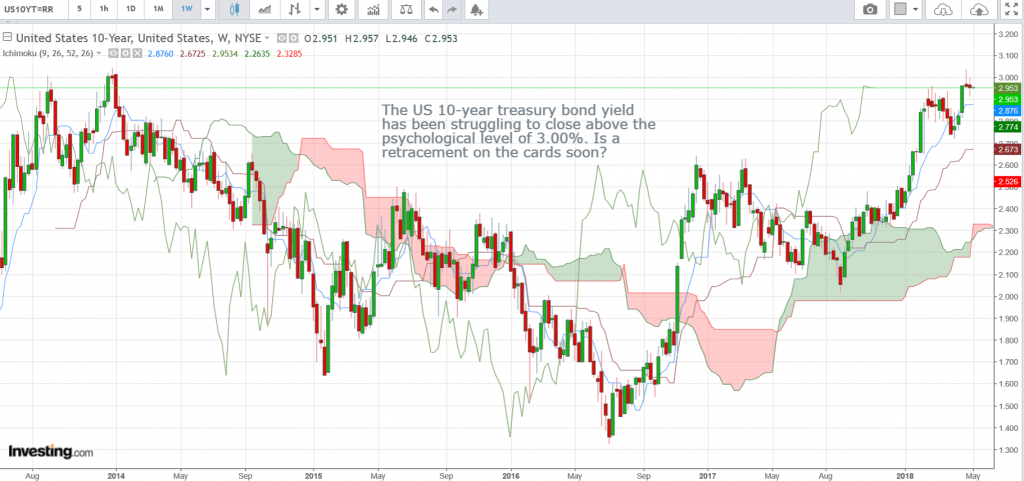
US 10-year Treasury Yield Weekly Candlesticks & Ichimoku Chart
The US 10-year treasury bond yield has been struggling to close above the psychological level of 3.00%. Is a retracement on the cards soon?
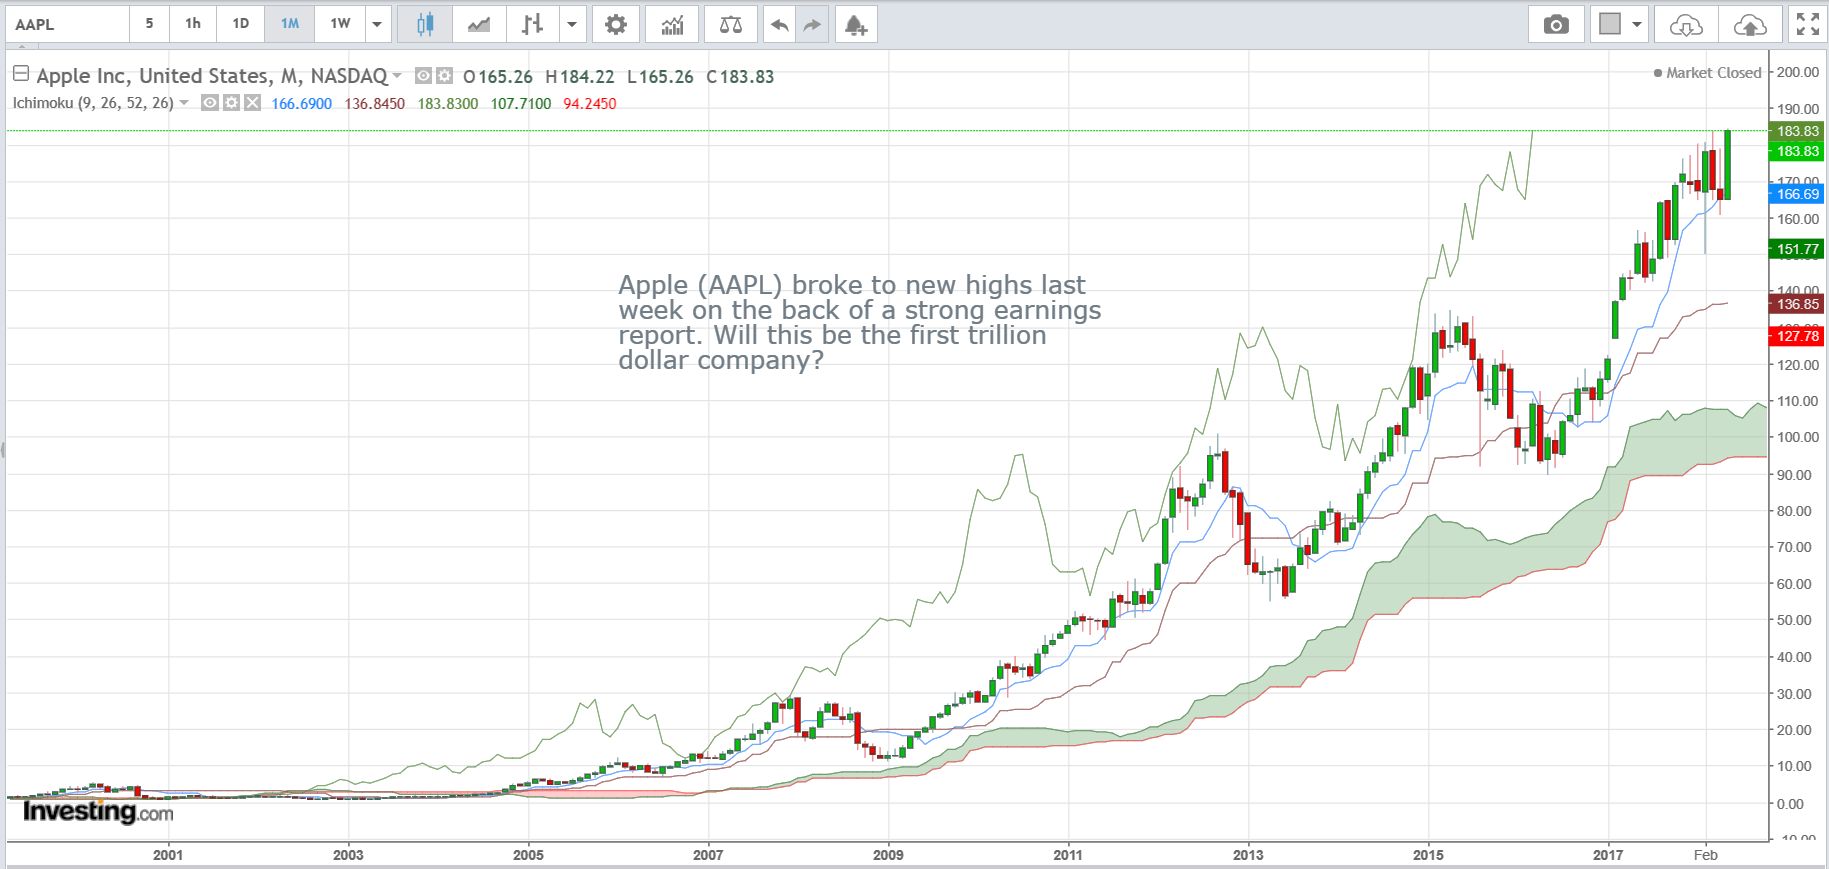
Apple (AAPL) Monthly Candlesticks & Ichimoku Chart
Apple (AAPL) broke to new highs last week on the back of a strong earnings report. Will this be the first trillion dollar company?
Vee, our Founder/CIO highlights patterns/formations on selected chart(s) every week which may have the potential to turn into trading opportunities. These charts are extracts of our weekly subscription product – “CIO’s Week Ahead Update” which provides analysis for the week ahead, first sent out on Monday of the week. Want to receive first hand information on these charts and learn how to leverage on possible trading opportunities? Click here!