WHAT HAPPENED YESTERDAY
As of Mon 24 Feb, Singapore Time zone UTC+8
FX
U.S. Dollar Index, -0.60%, 99.26
USDJPY, -0.48%, $111.58
EURUSD, +0.56%, $1.0845
GBPUSD, +0.70%, $1.2971
USDCAD, -0.26%, $1.3224
AUDUSD, +0.18%, $0.6628
NZDUSD, +0.21%, $0.6343
STOCK INDICES
S&P500, -1.05%, 3,337.75
Dow Jones, -0.78%, 28,992.41
Nasdaq, -1.79%, 9,576.59
Nikkei Futures, -0.94%, 23,290.0
COMMODITIES
Gold Futures, +1.73%, 1,644.60
Brent Oil Futures, -1.37%, 58.50
SUMMARY:
After several sessions of USD strength, USD finally ceded some ground as short-term speculators trimmed positions into the weekend, with GBP and EUR leading the way. Gold, however, remained bid and continued to power higher.
Gold continued its relentless march higher on Monday open as bad news piled up over the weekend with the Covid-19 situation worsening in South Korea, Iran and Italy.
U.S. stocks sold off to end the week, while investors continued to buy less risky assets, amid festering concerns about the Covid-19 and valuation. The Nasdaq Composite led the retreat with a -1.79% decline, followed by the S&P 500 (-1.05%), and Dow Jones Industrial Average (-0.78%).
Reported cases of the Covid-19 continued to climb in China, but that wasn’t new information for the market – or investors who were buying yesterday’s dip. Arguably, the bigger story was the continued flight-to-safety in gold ($1644.60/ozt, +1.73%) and U.S. Treasuries (30-yr yield set a new all-time low at 1.89%).
The defensive positioning was attributed not only to Covid-19 fostering growth concerns but also to the record run in U.S. stocks despite the Covid-19. The latter bolstered calls that the market had gotten overextended and was due for a pullback. The Markit flash services PMI for February, which fell into contraction territory, didn’t help sentiment, either.
CHINA STILL IN A CRUCIAL STAGE OF COVID-19 BATTLE, SAYS XI
China’s measures to deal with the Covid-19 outbreak have been effective, but the battle is still at a crucial stage, President Xi Jinping was quoted as saying on Sunday. He said the outbreak will have a relatively big hit on the economy and society but the government will step up policy support to help achieve economic and social development targets for 2020. China will maintain a prudent monetary policy and roll out new policy steps in a timely way, he said, adding the government will also study and roll out phased tax cuts to help tide small firms over difficulties.
IMPACT: Risk Assets extended losses on Monday while safe-haven gold soared as the spread of the Covid-19 outside China accelerated with infections jumping in South Korea, Italy and the Middle East.
SANDERS WIN BIG IN NEVADA DEMOCRATIC VOTE
Broad-based support across age, racial and ideological groups propelled Bernie Sanders to a dominant victory in Nevada’s Democratic caucuses, tightening his grip on the front-runner spot in the race to find a challenger to Trump. The race now begins to broaden across the country, with the next primary on Saturday in South Carolina, followed closely by the Super Tuesday contests in 14 states on March 3 that pick more than one-third of the pledged delegates who will help select a Democratic nominee.
IMPACT: Sanders’ triumph on Saturday in the first racially diverse state in the campaign suggested he was reaching a broader coalition of Democratic voters with his unapologetic message of social and economic justice, including his signature pledge to provide universal healthcare for all Americans.
SOUTH KOREA RAISES ALERT TO THE HIGHEST LEVEL AS COVID-19 CASES JUMP
South Korea raised its disease alert to the highest level on Sunday after a surge in Covid-19 infections and two more deaths, while China state media warned the outbreak there had yet to reach a turning point despite some signs of easing. The escalation in the alert level allows the government to send extra resources to Daegu city and Cheongdo county, which were designated “special care zones” on Friday. South Korea’s Yonhap News Agency said it also enables the government to forcibly prevent public activities and order the temporary closure of schools. The winter break of schools was extended by 1 week till 9 March.
IMPACT: South Korea is an important player in the semiconductor supply chain. As factories get shuttered in an attempt to control the outbreak, there will be knock-on effects on global electronic companies. Samsung, whose revenue contributes a decent portion to Korea’s GDP, fell in reaction to the situation. The South Korean Won will also face selling pressure should the situation in South Korea deteriorate.
DAY AHEAD
With not much on the economic calendar this week, the virus and its impact on economies globally will remain the primary driver of risk sentiment. Still, there are some important indicators worth keeping an eye on. Overall, there’s little to suggest that the dollar’s relentless rally is about to end, as the US economy is much better positioned than its rivals to weather any slowdown in China. That said, the more the dollar climbs, the greater the risk of verbal intervention by the White House.
SENTIMENT
OVERALL SENTIMENT:
Risk sentiment continues to erode as fear rises on the “surprising” deterioration of the Covid-19 situation. Market participants are confused with the break in correlation as JPY (usually a safe haven currency) continues to trade weak despite the strength of Gold and the weakness of stock indices.
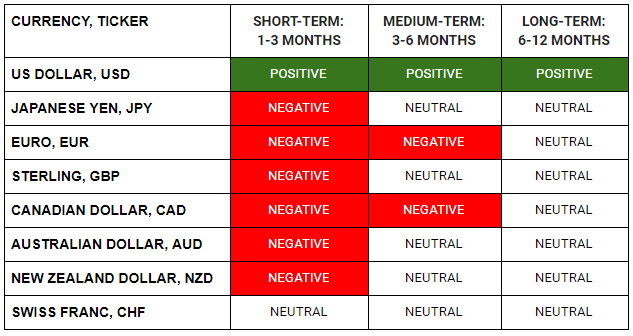
FX
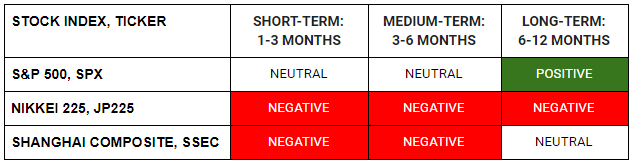
MARKETS
TRADING TIP
It is inevitable…
Many confuse themselves into thinking that the world should conform to their hopes and dreams and what they think it should be. Unfortunately, the world in real life just does not behave like that. Life would be a lot easier if it does…
To succeed at trading, we need to focus on what is, and what will be. “What will be” tends to be one of several scenarios of “what could be”. We should then try to assign to each of these scenarios the probabilities/likelihood of the respective scenario playing out.
Having done this, the task is then to find what are the trades that will benefit the most if we should be right, and lose the least if we should be wrong. Sometimes, if market pricing is skewed to the extent that we can risk very little for a low probability outcome and be rewarded handsomely when it happens, we should consider that as a possible good trade. (More on this later this week)
Sometimes, there are just situations where there are outcomes which are inevitable. Unfortunately, the world finds itself at this juncture right now. The spread of Covid-19 is inevitable given the complacency of many governments around the world. Unless the virus mutates to a much milder strain, the situation is going to worsen and the economy will suffer.
The spread may be contained if governments should decide to take drastic measures such as those that have been taken in some countries. If that should occur, there will be negative economic implications.
So again, unless the virus becomes milder, less infectious or gives up all together, the economy is in for a tough time. That is inevitable. Of course, we can hope for the best, but you know what they say about Hope and Trading…