
Disclaimer: The views and opinions expressed in this material do not constitute a recommendation by TrackRecord Pte Ltd or Gregg Tan and does not have regards to specific investment objectives, financial situation and/or the particular needs of any specific person. The main objective of this material is for educational and discussion purposes only. The technical views and commentaries are to facilitate the finer application of various technical tools. These technical views may be subject to further revision without notice. No part of this material may be reproduced or transmitted in any form or by any means, electronic, mechanical, photocopying, recording, or otherwise, without prior written permission of TrackRecord Pte Ltd or Gregg Tan.
The reports below are compiled by Gregg. Gregg has over 38 years of experience in the finance industry. His responsibilities in the initial 20 years was mainly with major Financial institutions, spanning across roles as a Trader, Dealer and as Head of Fundamental/ Technical Research of a team in Indonesia. He then spent the next 18 years at Bloomberg as an Application Specialist for Charting and Technical Analysis. Many of Bloomberg’s Institutional clients have acknowledged that they found true value at Gregg’s sessions. Gregg was a key contributor to Bloomberg’s charting ecosystem, as evident when the development team even rescheduled a planned global summit just to accommodate his busy schedule. Gregg has recently joined TrackRecord’s team of professional analysts to value-add to our existing offerings.
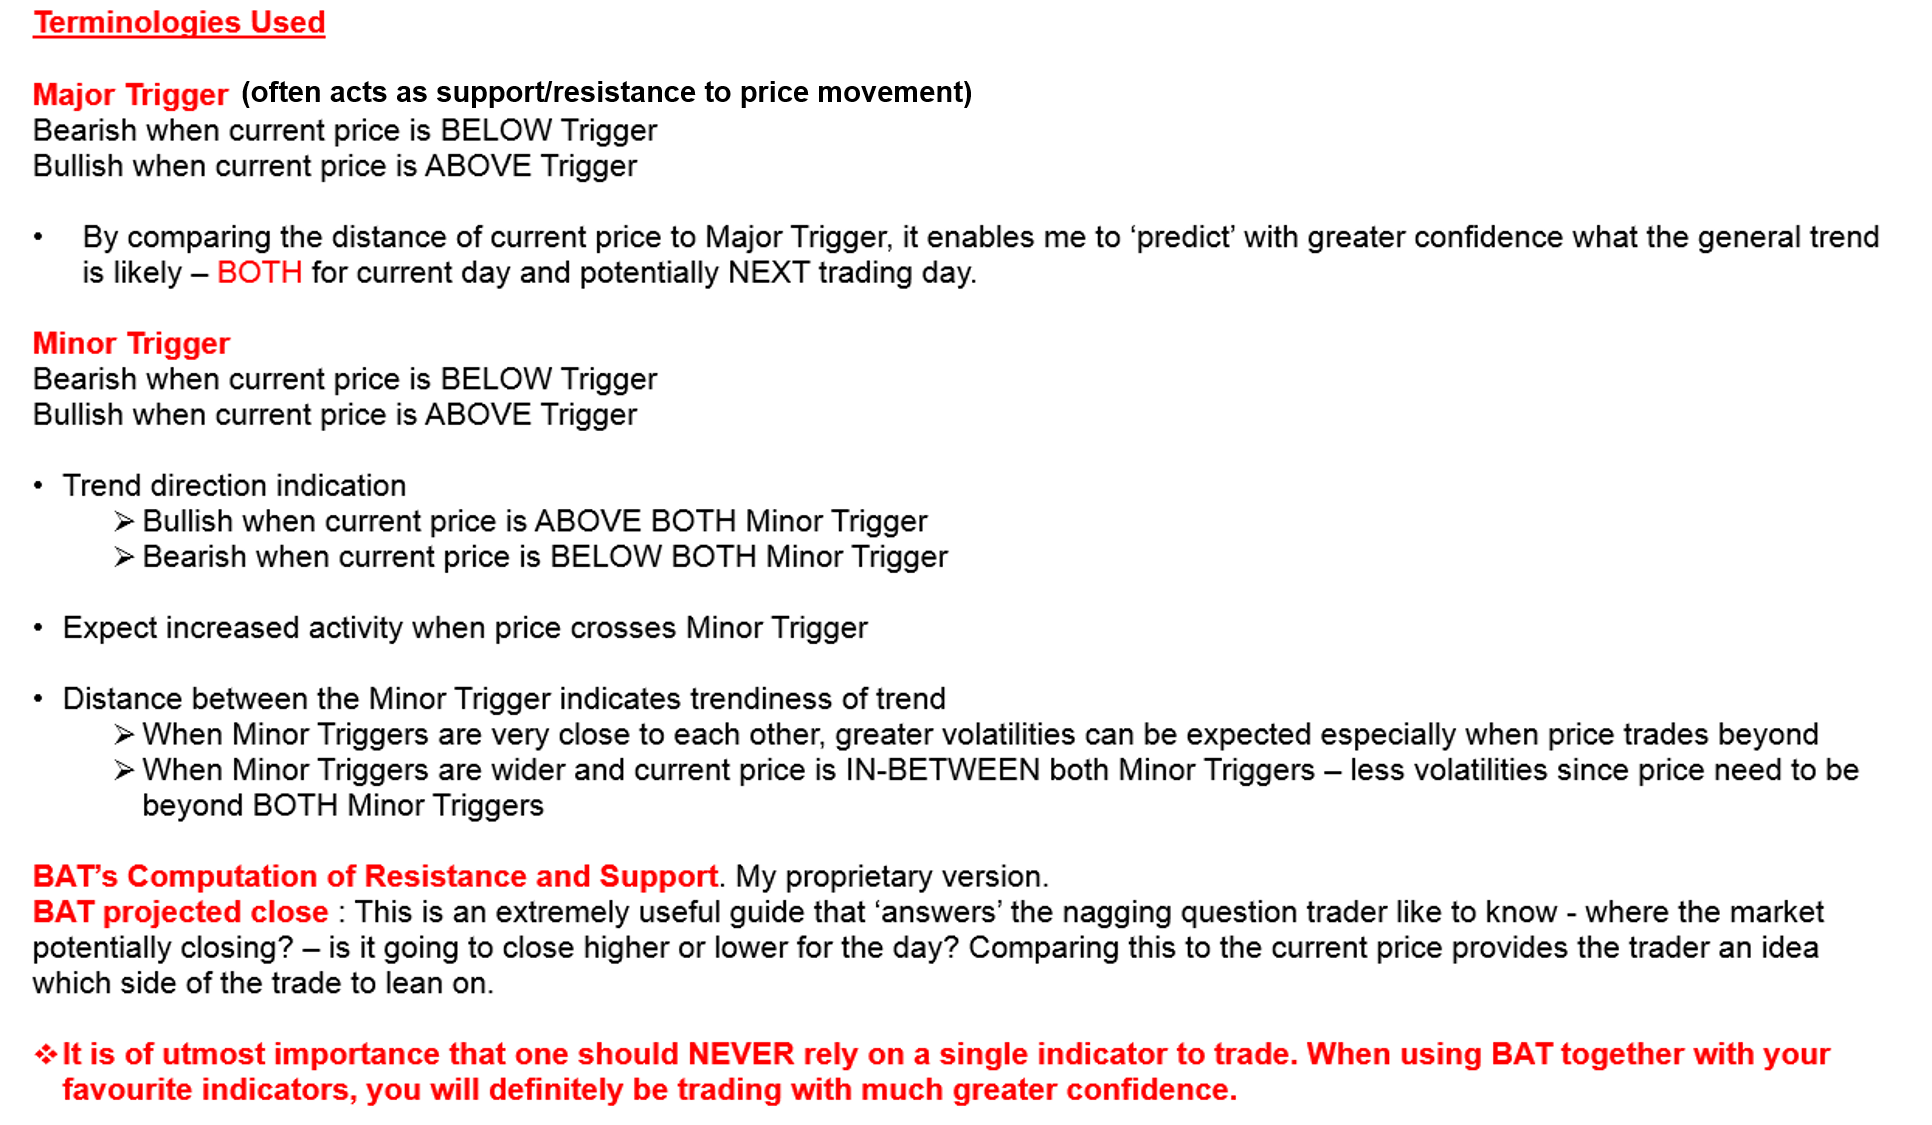
Boundaries & Triggers (BAT) – Key technical levels for Short-Term Trading based on Hourly/Intraday Charts
Boundaries & Triggers (BAT): 10 Feb 2020
Boundaries And Trigger (BAT) is a complex formula requiring the identification of unique price behaviour, price projections and BAT Triggers. The Triggers are levels that will likely attract immediate follow-through activities when price crosses it.
AUD/USD – 60 Mins (Click to view explanation on usage of BAT and Pivot Points)

EUR/USD – 60 Mins (Click to view explanation on usage of BAT and Pivot Points)

GBP/USD – 60 Mins (Click to view explanation on usage of BAT and Pivot Points)

USD/CHF – 60 Mins (Click to view explanation on usage of BAT and Pivot Points)

USD/JPY – 60 Mins (Click to view explanation on usage of BAT and Pivot Points)

USD/CAD – 60 Mins (Click to view explanation on usage of BAT and Pivot Points)

A Technician’s Perspective – Key technical levels based on daily/weekly charts and technical prognoses up to 4 weeks ahead
A Technician’s Perspective: 8 Feb 2020
XAUUSD – MONTHLY

USD/CAD – DAILY

Historical Identical Movements (HIM) – Likely Long-Term Moves based on similar patterns in the past
Historical Identical Movements (HIM): 8 Feb 2020
Humans are creatures of habit and oftentimes react in a similar way to identical financial events or price swings. These emotional reactions are reflected in price activities which can be visualised on a chart. The Historical Identical Movements (HIM) displayed below reveals an almost identical movement in its past, if HIM were to repeat, it can be used as a visual guide for movements ahead. Be forewarned that I rely on various charting techniques and technical tools for my actual market analysis. All analysis only attempts to forecast the likely movement ahead, HIM provides an ‘insight’ into how price could unfold ahead of time. Do note that HIM employs a totally different approach from “A Technician’s Perspective” report. HIM’s sole purpose is to locate Historical Identical Movements that are almost identical to current price setup. Should projected path in HIM (movement after the light blue demarcation) align with “A Technician’s Perspective” report – it is at best a visual guide to how price could unfold.


